
Figure 4.
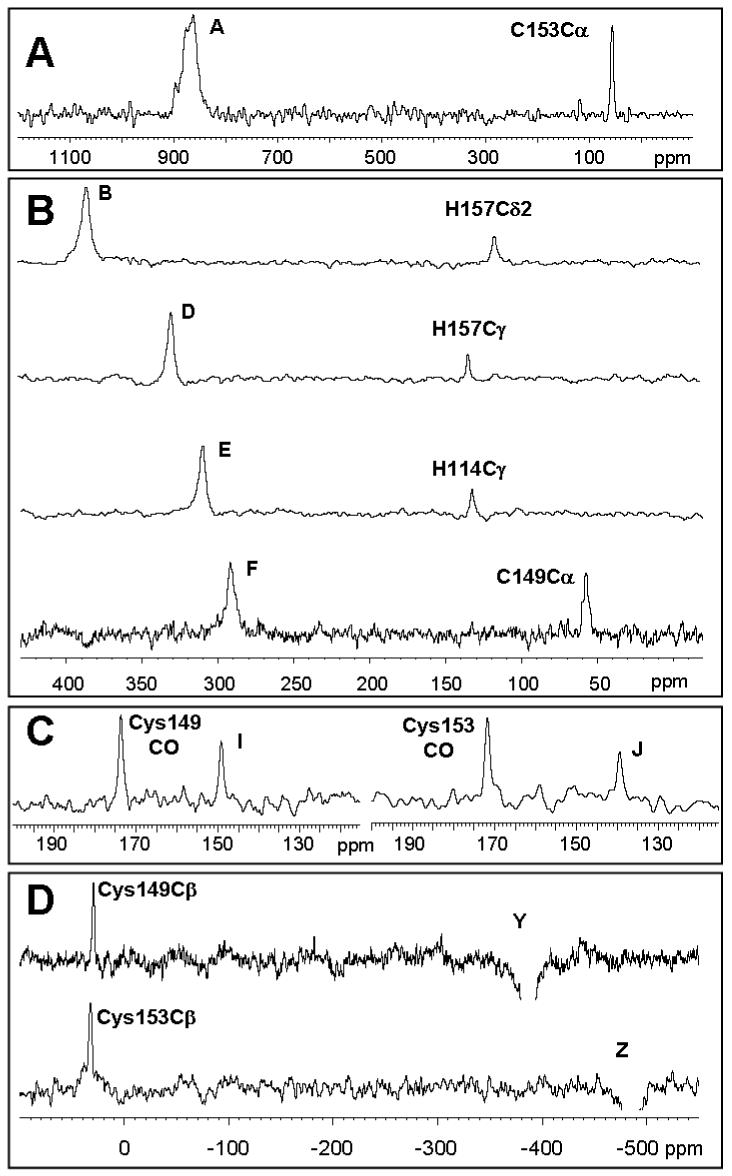
Saturation Transfer Difference spectra obtained by irradiation of 13C resonances A (panel A), B, D, E, F (panel B), Y and Z (panel D) on a fully-labeled sample, and I and J (panel C) on a sample labeled at the cysteine residues. Experiments performed at 298 K.