
Figure 5.
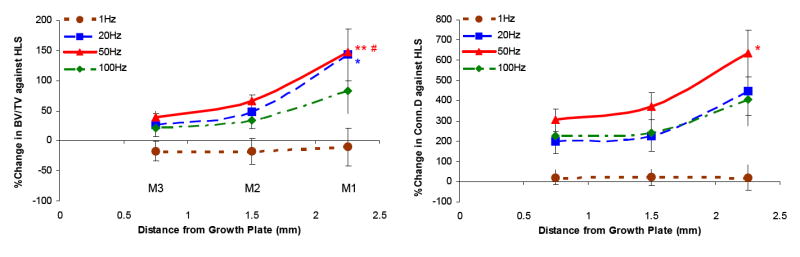
Graphs show the percentage differences between HLS and MS experimental groups ± SD values in all three metaphyseal regions for bone volume fraction (BV/TV) and connectivity density (Conn.D). For MS with mid to high stimulation frequencies, the levels of effectiveness on trabecular bone against functional disuse alone were always greatest at M1 and least at M3. **p <0.001 vs. M3; *p <0.05 vs. M3; #p <0.001 vs. M2.