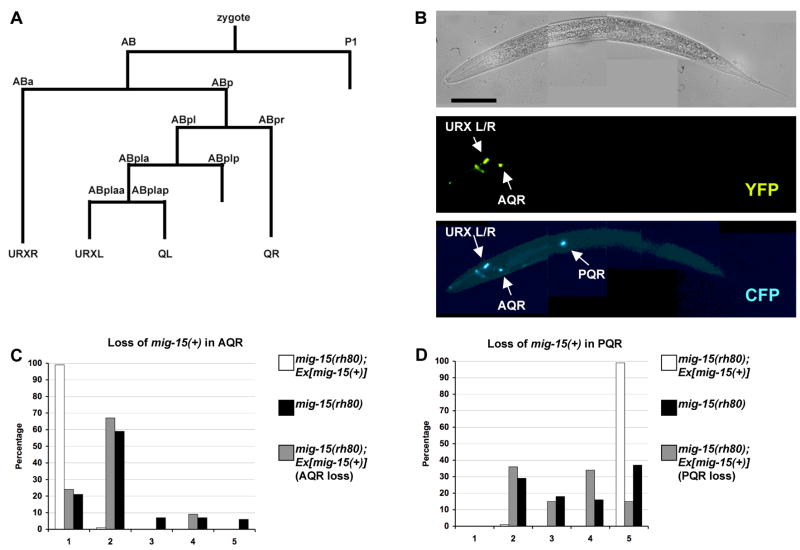
Figure 10. MIG-15 NIK kinase acts cell autonomously in AQR and PQR migration.
(A) The cell lineage map for the gcy-32-expressing cells. Not all divisions or cells are shown. (B) A mosaic animal that had lost the mig-15(+) transgene in the PQR neuron. The top micrograph is a Nomarski image. The middle micrograph shows that this animal has lost the mig-15(+) transgene in the PQR neuron as indicated by the lack of YFP expression in PQR. The bottom micrograph shows the position of AQR and PQR using an integrated gcy-32::cfp reporter. PQR reversed direction of migration. The scale bar in the top micrograph represents 50μm for all 3 micrographs in (B). (C–F) Quantitation of the final migratory positions of PQR and AQR in mig-15(rh80) and in mosaics.


