
Figure 3.
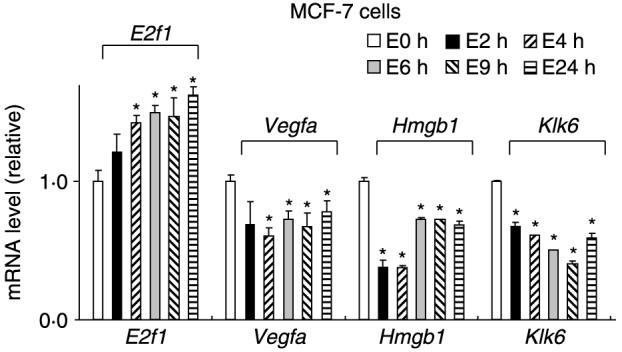
Time course effects of E2. MCF-7 cells were treated with 20 nM E2 for various times and expression of E2f1, Vegfa, Hmgb1, and Klk6 was determined (in triplicate) by real-time PCR (normalized to TBP) as outlined in the Materials and methods. Significant (P<0·05) induction or inhibition is indicated by *.