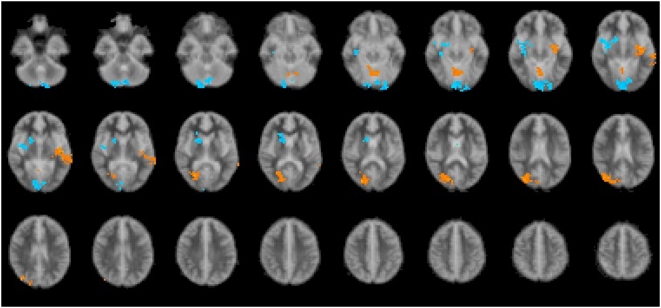
Figure 1. Combined brain map (Radiological format).
Brain areas in all conditions in which Low mathematical ability group showed higher activation than the High mathematical ability group are in blue. Brain areas in all conditions in which High mathematics ability group showed higher activation than the Low mathematical ability group are in yellow.

