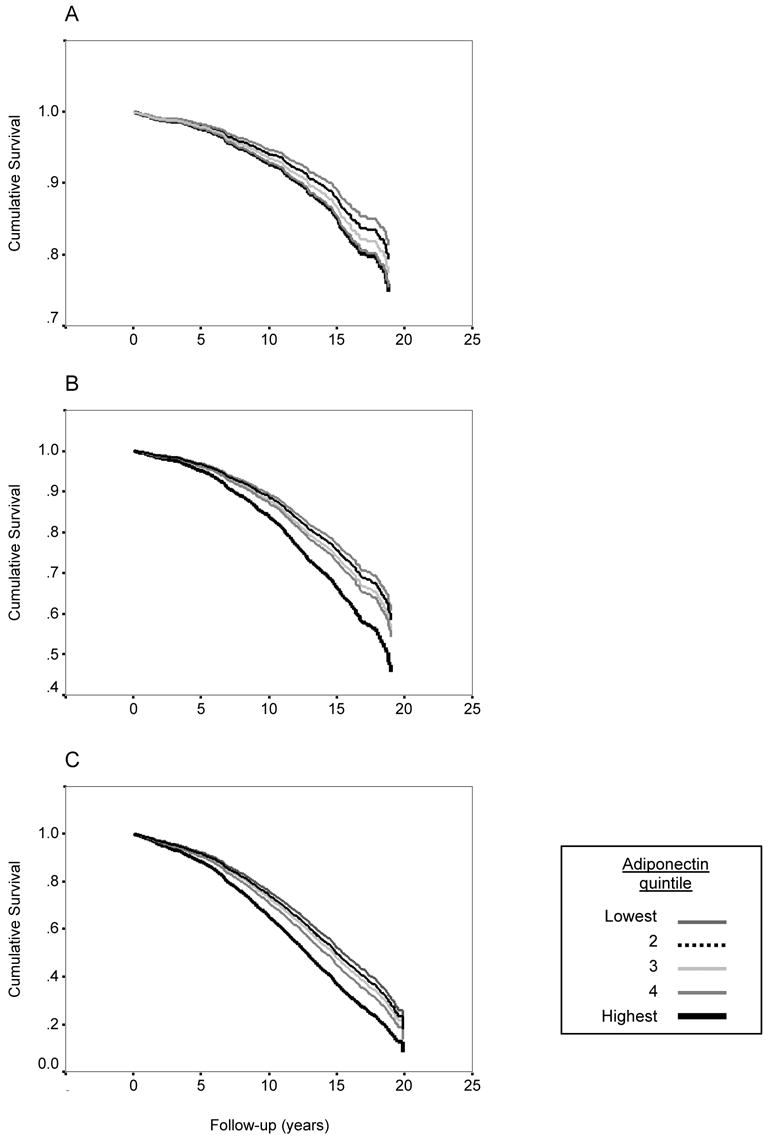
Figure 1.

Survival curves according to quintiles of adiponectin for (A) CHD mortality, (B) CVD mortality, and (C) all cause mortality, adjusting for age, sex, waist girth, HDL cholesterol, triglycerides, and fasting plasma glucose. Hazards ratios for the highest versus the lowest quintile were: CHD 1.13, 95% CI 0.69, 1.85; CVD: 1.46, 95% CI 1.04, 2.07; all cause: 1.43, 95% CI 1.13, 1.82. Probability values for trend across the adiponectin quintiles were p=0.51, p=0.015, and p=0.002, respectively. Note differences in y-axis scales.
