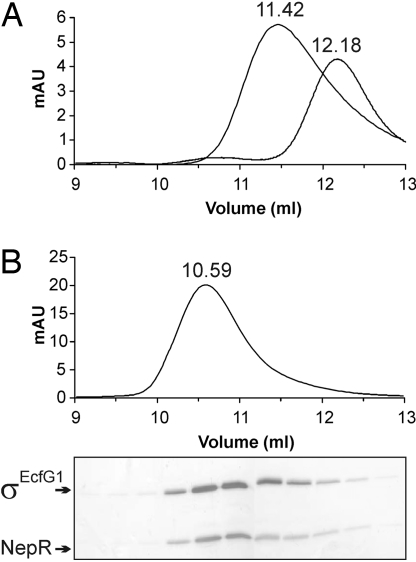
Fig. 3.
NepR forms a complex with σEcfG1. (A) Elution profile of purified σEcfG1 and NepR (4 μM) analyzed separately by gel filtration using a Superdex 75 10/300 column (flow rate, 0.5 mL/min). (B) Mixture of equimolar of each protein (8 μM each) led to the formation of a heterodimeric complex of σEcfG1 and NepR. Fractions were collected and analyzed on a 15% SDS-polyacrylamide gel and silver stained. The exact elution volume is indicated above the absorption peak.

