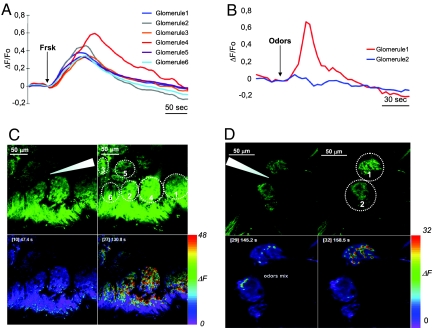
Fig. 4.
[Ca2+] dynamics in glomeruli. (A and B) Changes in fluorescence (ΔF/F0) in different glomeruli in hemi-head preparations after focal stimulation with (A) forskolin (Frsk, 250 μM in pipette) or (B) odor mixture (1 mM in pipette). (C Upper and D Upper) Images of Calcium Green dextran loaded glomeruli; before (Left) and after (Right) forskolin (C Upper) or odor stimulation (D Upper). (C Lower and D Lower) The images are presented in pseudocolors. Bar on right represents the pseudocolor scale of the difference in fluorescence intensity, ΔF (in arbitrary units), between the peak of the response (Right) and the basal condition (Left) of forskolin (C Lower) and odor mixture application (D Lower). Arrowheads indicate stimulus-pipette position; colored lines and circles indicate glomeruli.

