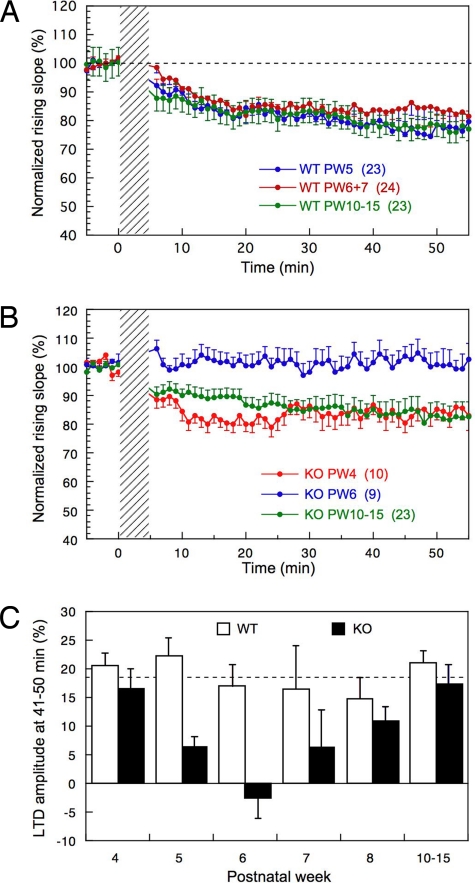
Fig. 3.
Age-dependent expression of cerebellar LTD in G-substrate–lacking Purkinje cells. (A) Averaged time profile of 3 groups of WT Purkinje cells is shown with different colors. The ordinate illustrates the rising slope of PF-EPSPs relative to the average measured 5 min before conjunction, and the abscissa illustrates time. The oblique-shaded band indicates the application of conjunction of PF stimulation and depolarizing pulses. Number of Purkinje cells tested is shown in brackets. Vertical bars, SEs. (B) Similar to A but for G-substrate–deficient Purkinje cells. (C) Histograms showing LTD amplitude at 41–50 min for different PWs in WT and G-substrate–deficient Purkinje cells. Filled columns are G-substrate knockout mice, and empty columns are WT littermates. Vertical bars, SEs. The numbers of cells used for the experiments are as follows: for WT mice, PW4 (12), PW5 (23), PW6 (14), PW7 (10), PW8 (14), and PW10–15 (23); for G-substrate knockout mice, PW4 (10), PW5 (9), PW6 (9), PW7 (6), PW8 (11), and PW10–15 (29).

