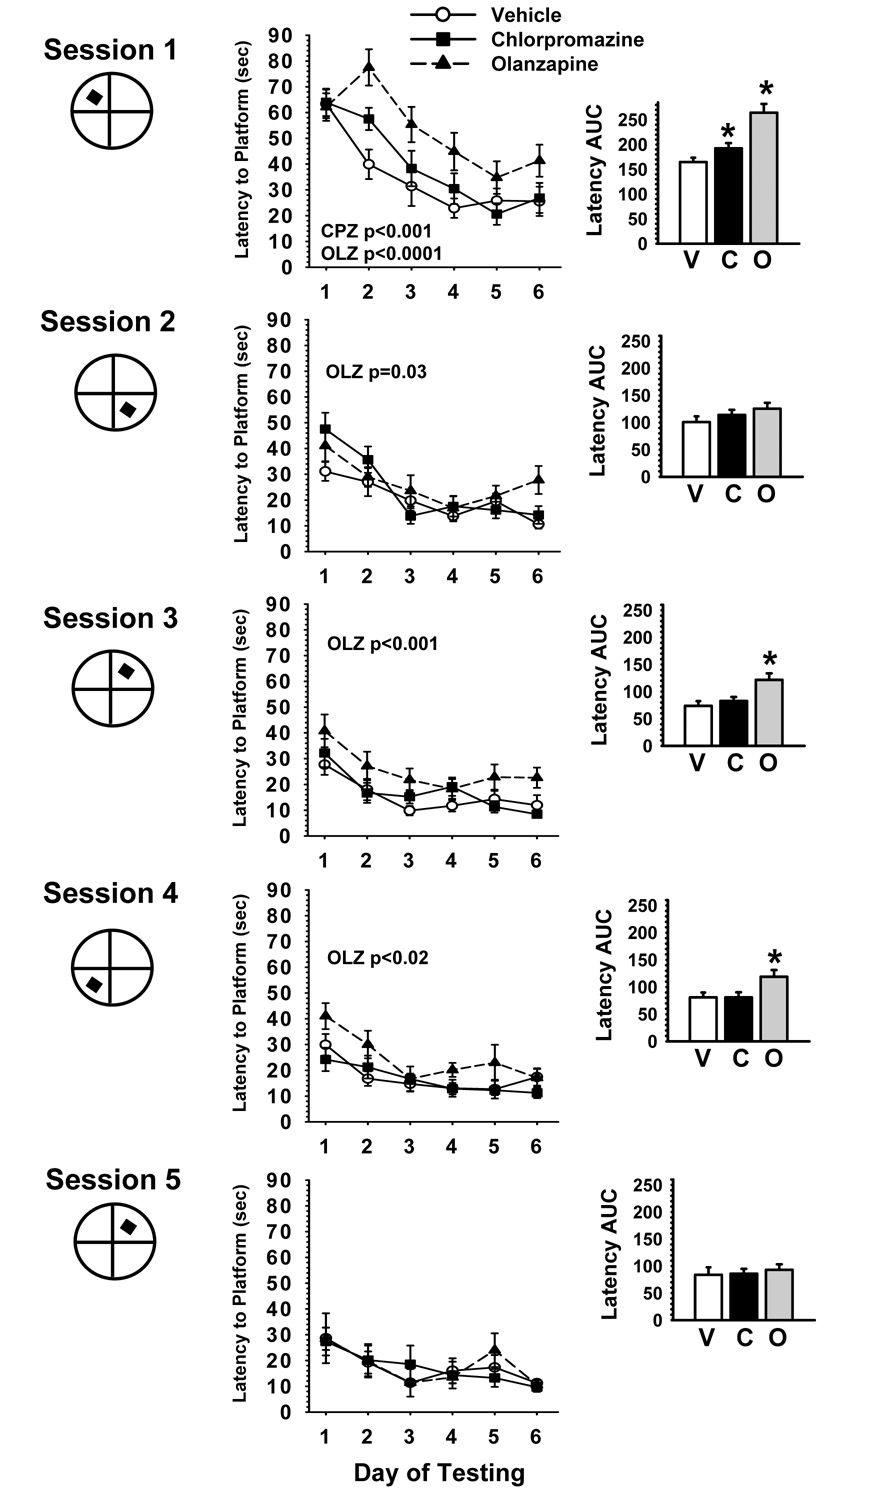
Fig. 1.
Antipsychotic effects on a water maze repeated acquisition procedure. S refers to the testing session, hidden platform tests were conducted during the first 6 days of each session. S1 = days 8–14; S2= days 22–28; S3 =days 39–45; S4 = days 84–90; S5= days 174–180 of drug treatment. For each session, the hidden platform was moved to a new quadrant location in the pool. Each point of the plotted curves represents the mean latency in seconds ± SEM for each testing day. Inset. Latency Area Under the Curve (AUC). Each bar represents the mean latency AUC ± SEM. VEH (or V) =Vehicle; CPZ (or C) =chlorpromazine 10.0mg/kg/day; OLZ (or O) =olanzapine 10.0mg/kg/day. Within each session, treatment effects (across the session) are noted when significant (p<0.05). Post hoc differences are indicated as follows: * = significantly (p<0.05) inferior performance when compared to vehicle control.

