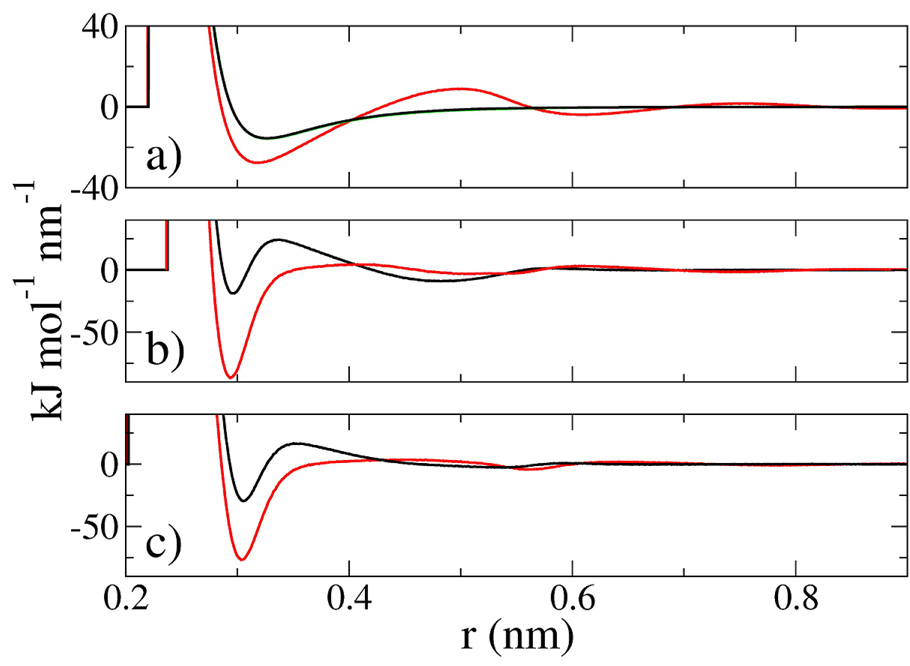
Figure 3.
The MS-CG force field (black curve) is compared with the mean force (red curve) for the LJ (panel a), SPC-COG (panel b), and SPC-COM (panel c) systems. The difference between the MS-CG force and the mean force arises from the incorporation of three-particle correlations in the MS-CG method according to eq (16). The MS-CG force field for the LJ system is also compared with the exact LJ force field (light green curve) in panel (a) and the difference is seen to be within the thickness of the curve.

