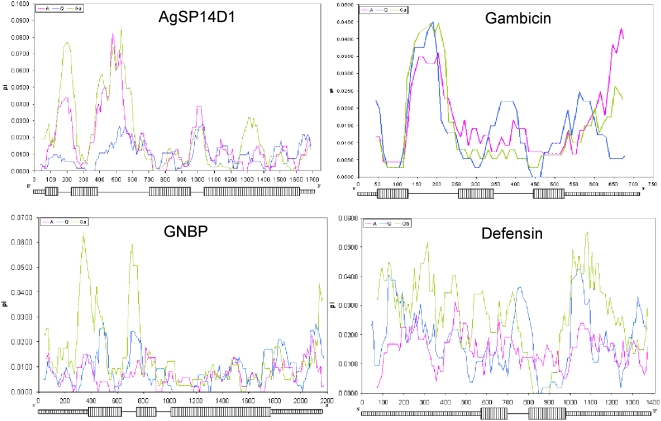
Figure 2. Polymorphism along the gene using sliding window (window length = 50 bp; sliding interval = 10 bp).
Exons and flanking regions are denoted by broad and narrow hatched rectangles, respectively; introns are denoted by lines. A, Q, and Ga denote An. arabiensis, An. quadriannulatus, and An. gambiae from western Kenya, respectively.

