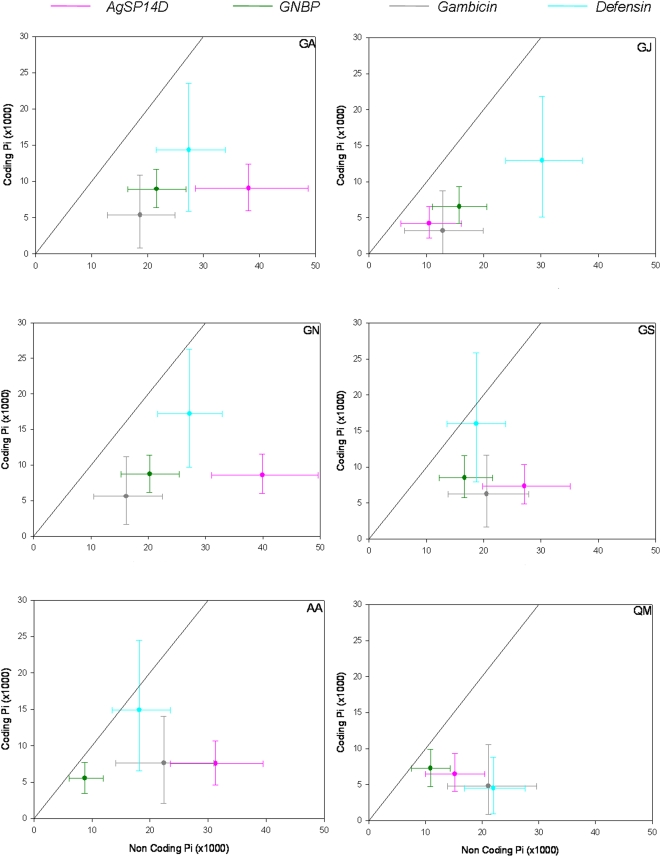
Figure 3. Diversity (π) and 95% CI in coding and NC regions in each population.
Diagonal lines mark equal diversity of coding and NC regions. GA, GJ, GN, and GS denote An. gambiae populations from western and eastern Kenya, Nigeria and Senegal, respectively. AA and and QM denote An. arabiensis and An. quadriannulatus respectively.

