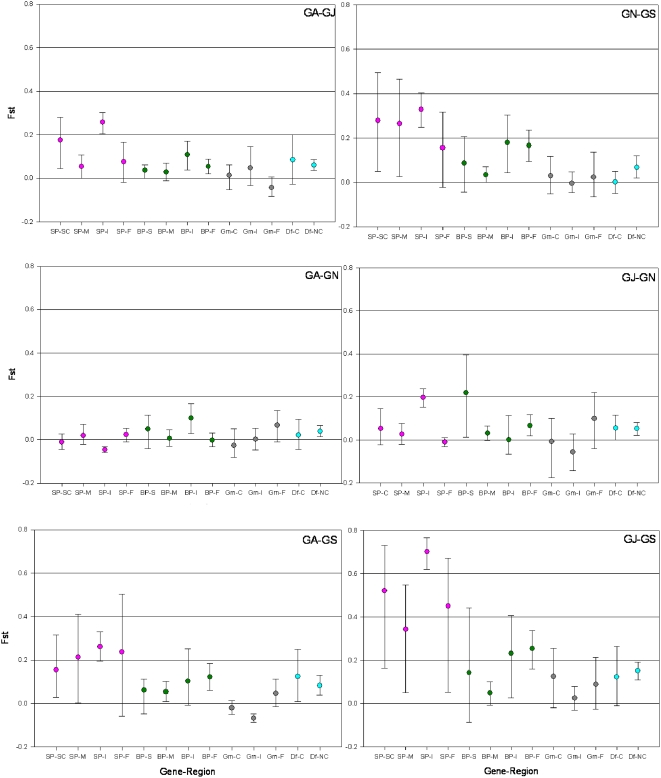
Figure 5. Differentiation between An. gambiae populations measured by FST in different functional regions of each gene.
The 95% CI of each value were estimated by bootstrapping over positions (1000 bootstrap replications) provided that there were five or more variable positions in that gene segment across the pair of populations compared. The number of variable positions is shown if it is below 10. Horizontal axis legend is the same as in Figure 4.

