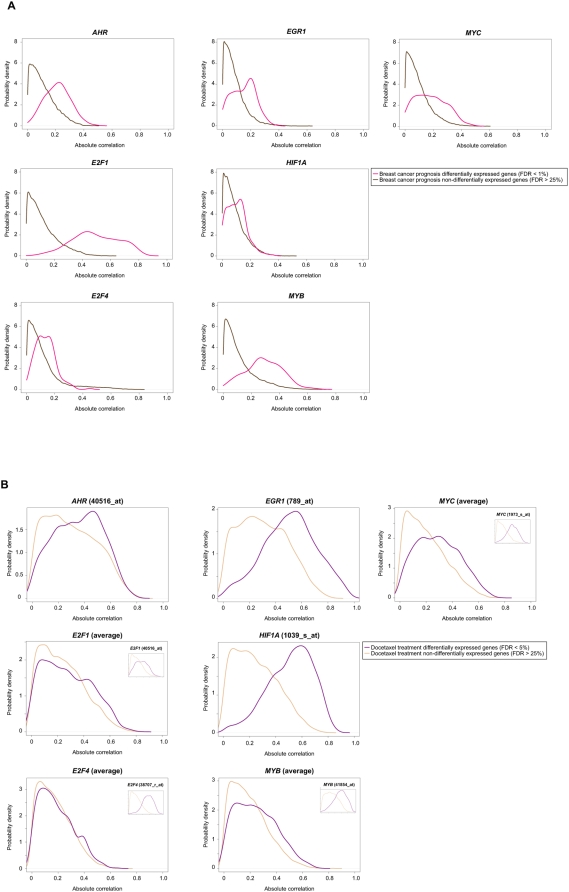
Figure 3. Expression correlations with defined transcription factors.
A, expression correlations between seven transcription factors―gene names shown at the top of each graph―and genes differentially expressed for breast cancer prognosis measured by metastasis events up to 5 years (pink curves) relative to non-differentially expressed genes in this condition (brown curves). The graphs show absolute PCC values. B, same analysis for differentially expressed genes after docetaxel treatment of breast cancer patients relative to non-differentially expressed genes in this condition. Results for E2F1, E2F4, MYB and MYC are for average values of all microarray probes representing each factor, whereas the insets show the results for individual probes with significant differences.

