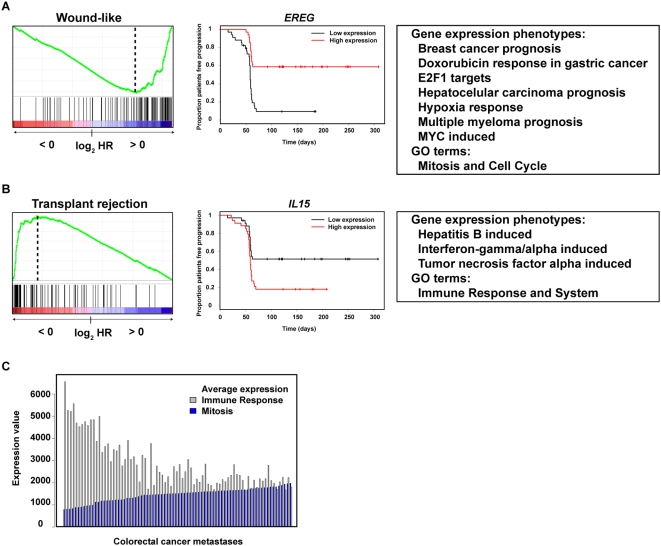
Figure 6. Asymmetric distribution of gene annotations in the response to cetuximab treatment.
A, left panel, GSEA results for the strongest associated phenotype with high-expression genes predicting treatment response (log2 HR>0). Central panel, expression analysis plot of the extreme gene expression (EREG), which was also noted in the original publication [47]. Right panel, additional phenotypic and GO term sets with high-expression genes associated to treatment response at FDR Q values<1%. B, left panel, GSEA results for the strongest associated phenotype with low-expression genes predicting treatment response (log2 HR<0). Central panel, expression analysis plot of the extreme gene expression (IL15). Right panel, additional phenotypic and GO term sets with low-expression genes associated to treatment response at FDR Q values<1%. C, Histogram plot of average expression values of genes annotated with the Immune Response or Mitosis across samples in the cetuximab dataset. Average GO set expression values show a negative correlation with ordered metastatic samples.

