Fig. 1.
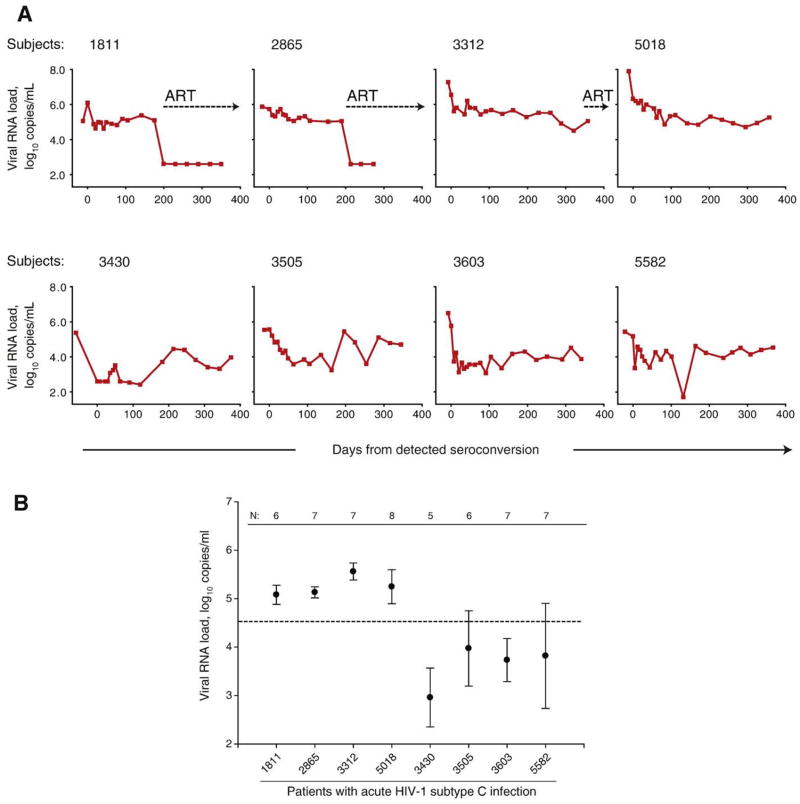
Viral RNA load in acute HIV-1 subtype C infection. (A) Individual curves of viral RNA load in eight cases of acute infection. The timeline shows days from detected seroconversion. Time 0 corresponds to the first seropositive test. Plasma viral RNA load is expressed as log10 copies per ml of plasma. Measurements of viral RNA before time 0 are pre-seroconversion. Numbers at top of boxes correspond to subject cases. Dotted lines with arrows indicate initiation of ART. (B) Early viral RNA set point in acute HIV-1 subtype C infection. The level of viral RNA at early set point was defined as a mean ± standard deviation of measurements from 50 to 200 days from detected seroconversion (after assuming reduction of viral RNA peak). N shows the number of viral RNA measurements for the period from 50 to 200 days per subject. Dashed line shows a median of early viral RNA set point computed for all eight subjects at 4.53 log10 copies/ml. The first four subjects 1811, 2865, 3312, and 5018 correspond to the group of slow decline of viral RNA and high early viral RNA set point. Subjects 3430, 3505, 3603, and 5582 correspond to the group of fast decline of viral RNA and low early viral RNA set point.

