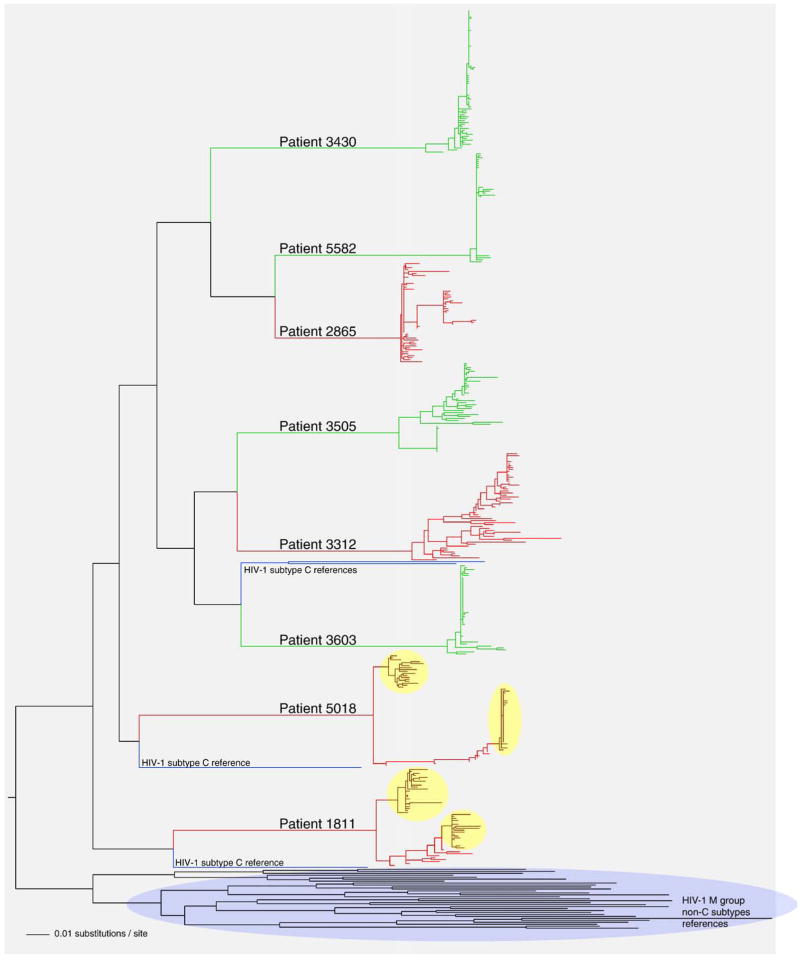
Fig. 2.
Phylogenetic relationships of gp120 sequences in acute HIV-1 subtype C infection. A phylogenetic tree was generated by PhyML (Guindon and Gascuel, 2003) using the HKY model for nucleotide substitution, and visualized in FigTree v.1.1.2 (Rambaut, 2008). Main branches are labeled with subjects’ numbers. Coloring corresponds to the viral RNA phenotypes: subjects with slow decline of viral RNA and a high early viral RNA set point are shown in red, and subjects with fast decline of viral RNA and a low early viral RNA set point are shown in green. Clusters are highlighted for subjects 1811 and 5018. HIV-1 subtype reference sequences are shown in blue. The cluster of all HIV-1 M group non-subtype C references is shown at the bottom.

