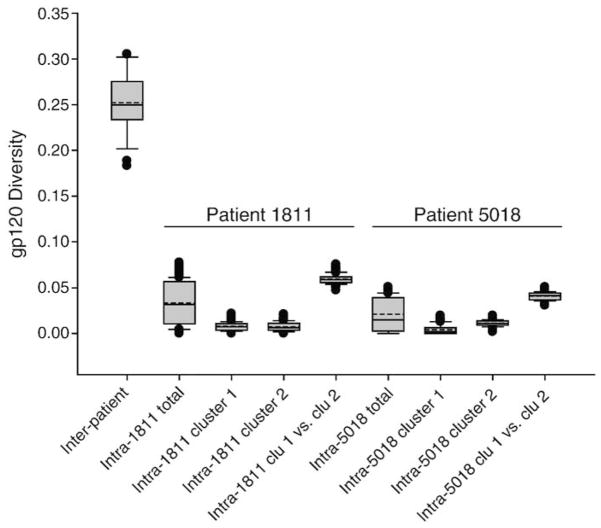
Fig. 3.
A comparison of inter-patient viral diversity in 8 subjects and intra-patient diversity in subjects 1811 and 5018. Pairwise maximum likelihood distances are shown. The inter-patient viral diversity was quantified as pairwise distances between MRCA of 8 subjects. The intra-patient diversity was measured as pairwise distances between viral quasispecies within each subject or each cluster. Distance between clusters were compared by quantifying pairwise distances between sequences belonging to each cluster. In the box plots: the boundary of the box closest to zero indicates the 25th percentile, a solid line within the box marks the median value, a dashed line within the box shows the mean, and the boundary of the box farthest from zero indicates the 75th percentile. Whiskers above and below the box indicate the 10th and 90th percentiles. Points above and below the whiskers indicate outliers outside the 10th and 90th percentiles.

