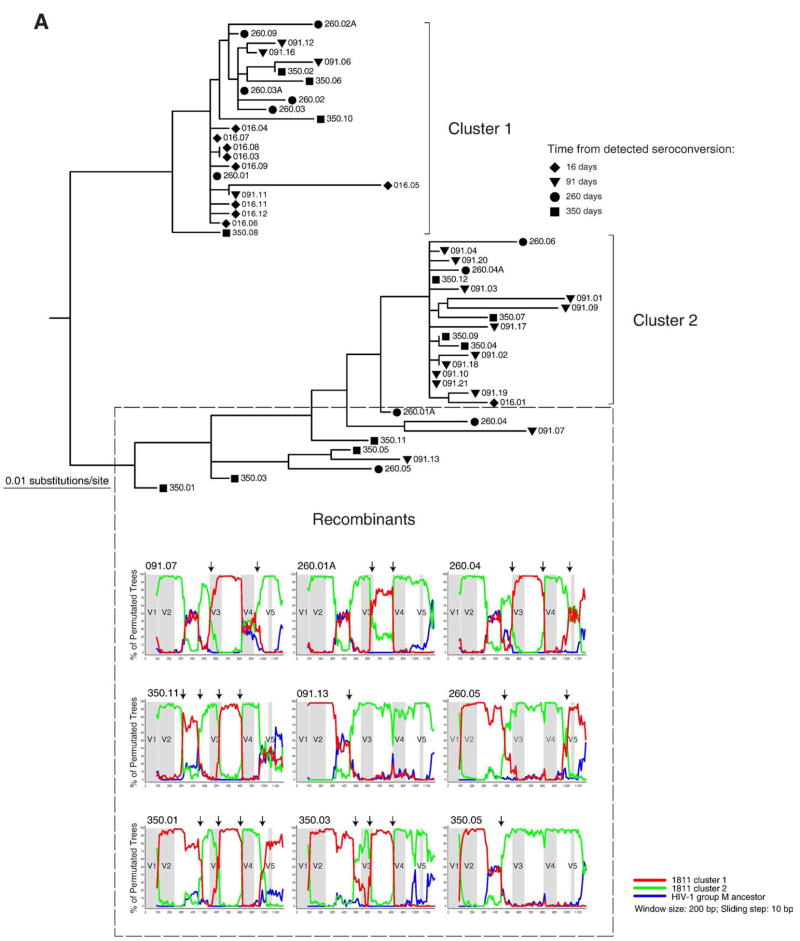
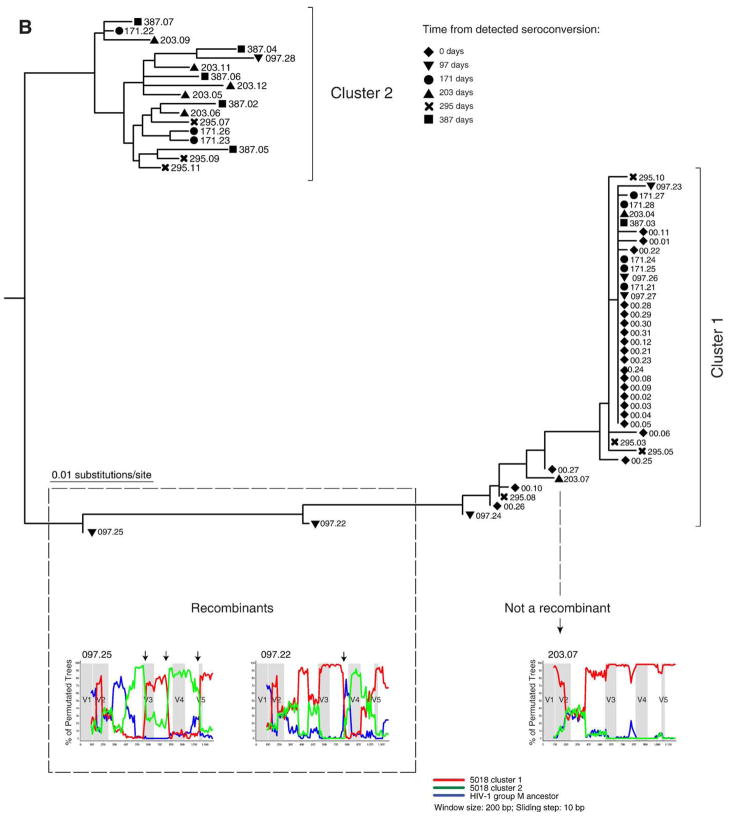
Fig. 4.
Analysis for potential recombination in subjects 1811 and 5018. Distinct clusters and potential recombinants are defined. Each sequence is shown by a symbol corresponding to time points of sampling followed by number of days from detected seroconversion and ID of viral quasispecies. The recombinant search was performed by bootstrap analysis in the SimPlot program (Lole et al., 1999). The HIV-1 group M ancestor sequence was used as outlier (blue line). Arrows on the top of bootstrap graphs designate potential breakpoints of recombination between viral variants. The location of variable loops in gp120 is shaded. (A) Subject 1811. Time points of sampling are shown by a diamond at 16 days, a triangle to the bottom at 91 days, a circle at 260 days, and a square at 350 days. The 16 day sequences in cluster 1 and sequence 016.01 were used as references for the first (red) and second (green) clusters. The red and green lines correspond to bootstrap values per sliding window. (B) Subject 5018. Time points of sampling are designated by a diamond at day 0, a triangle to the bottom at 97 days, a circle at 171 days, a triangle to the top at 203 days, a cross at 295 days, and a square at 387 days. The 0 time point sequences in cluster 1 and majority consensus sequence for the entire cluster 2 were used as references for the first and second cluster (red and green lines correspond to bootstrap values, respectively).


