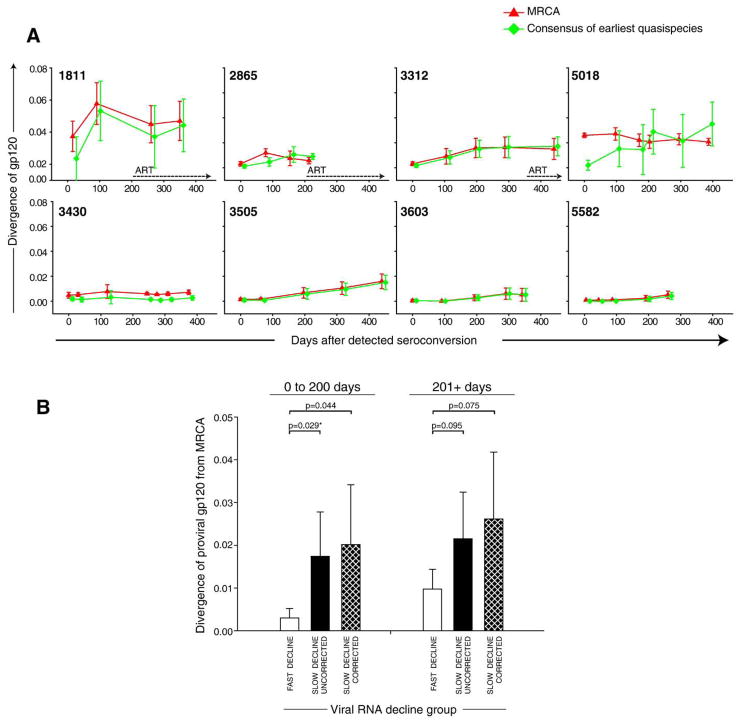
Fig. 6.
Diversification of viral gp120 in acute HIV-1 subtype C infection. Mean values±standard deviation are shown. Viral diversification at each time point was compared to the per-subject MRCA sequence reconstructed from viral quasispecies at all time points (red triangle), and consensus sequence reconstructed from the earliest available quasispecies (green square). The timeline shows days from detected seroconversion. (A) Individual trajectories of viral diversification. Numbers within boxes correspond to subject cases. Dotted lines with arrows indicate initiation of ART. (B) Viral diversification from MRCA that was reconstructed from viral quasispecies is compared between groups defined on viral RNA phenotype, fast and slow decline of viral RNA. The slow decline group is presented in two ways: by uncorrected distances (defined as total intra-patient pairwise distances to MRCA) and cluster-corrected distances (defined as intra-cluster pairwise distances to MRCA, no recombinants were included). Analysis was performed for two time intervals: 0 to 200 days and 201+ days after seroconversion. Comparison between groups is performed by t-test or Mann–Whitney Rank Sum Test (shown with *).

