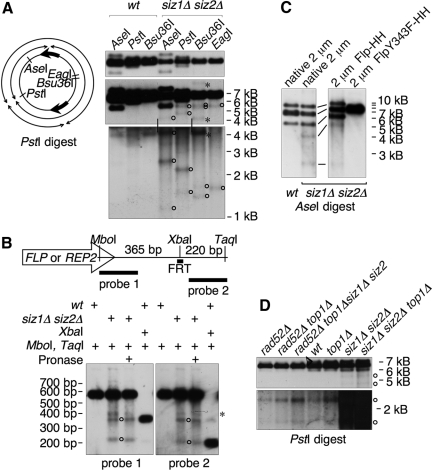
Figure 6.
The HMW form contains apparent DSBs. (A) Left, diagram of 2 μm monomer showing positions of restriction sites and illustrating the four fragments that would be formed by a PstI digest combined with breaks at FRT. Right, yeast DNA from the indicated strains was digested with indicated restriction enzyme and analyzed by Southern blotting with a probe against 2 μm. All panels are different exposures of the same blot. siz1Δ siz2Δ samples were slightly underloaded relative to wt. Vertical lines indicate bands that are the same between the middle and bottom panels. Open circles indicate bands representing apparent DSBs near FRT. Asterisks indicate bands that result from incomplete digests. (B) Top, diagram of 599-base pair internal repeat (IR) sequence, showing positions of restriction sites, FLP/REP2 gene (transcripts from both genes extend into the same side of the IR), FRT, and probes. Flp generates a single-strand break at one of two sites 8 base pairs apart within FRT, and the XbaI site is between these. Bottom, DNA from indicated strains digested with indicated restriction enzymes was analyzed by Southern blotting using the indicated probes (see Materials and Methods). Duplicate samples were run on the same gel and blotted, and the blot was cut in half and analyzed with different probes. Some samples were treated with Pronase in an attempt to test whether part of the Flp protein was still attached to these DNAs, but no effect was seen. Circles designate bands that represent DSBs in the IR. The band marked with an asterisk does not appear to represent a DSB, because no corresponding small band is present. We do not know what this band is. (C) DNA from indicated strains containing indicated versions of 2 μm were analyzed as in A. Only two DSB bands are visible with AseI; the other two predicted bands are not visible because one is the same size as the head-to-head dimer band, whereas the other is small and is obscured by background. Panels are from the same exposure of the same blot. (D) DNA from the indicated strains was analyzed as in A. Panels are from different exposures of the same blot.

