Figure 2.
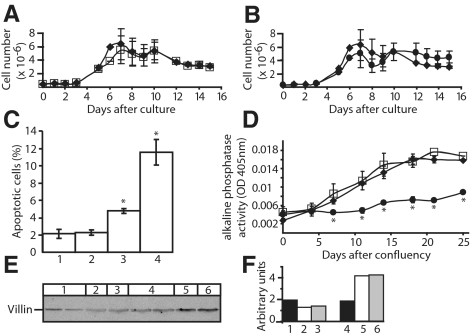
Effects of FXYD3 gene silencing on Caco-2 cell proliferation (A and B), apoptosis (C) and differentiation (D–F). (A and B) Cell proliferation was estimated by direct count of viable cells after different time points in culture. ♦, wild-type Caco-2 cells; □, siRNA1-treated Caco-2 cells; ●, and siRNA2-treated Caco-2 cells. Four independent experiments in duplicates were performed for wild-type, siRNA1-, and siRNA2-treated cells. Data are means ± SEM. (C) Condensed and fragmented nuclei were scored in nonconfluent cells stained with DAPI as described in Material and Methods. 1, wild-type Caco-2 cells; 2, siRNA1-treated Caco-2 cells; 3, siRNA2-treated Caco-2 cells; and 4, wild-type Caco-2 cells treated with 20 mM butyrate for 2 d. Approximately 1000 cells were scored for each condition. Shown are means ± SEM of four independent experiments. *p < 0.006 versus wild-type Caco-2 cells. (D–F) FXYD3 gene silencing prevents Caco-2 cell differentiation. (D) The activity of ALP was measured in cell lysates after different time points after cell confluency. Results were normalized to cellular protein content. Data are means ± SEM of three independent experiments in duplicates. *p < 0.05. ♦, wild-type Caco-2 cells; □, siRNA1-treated Caco-2 cells; and ●, siRNA2-treated Caco-2 cells. (E) Western blot analysis of villin expression in wild-type and siRNA-treated Caco-2 cells. Fifty micrograms of proteins of cell lysates were subjected to SDS-PAGE, transferred onto nitrocellulose membranes, and villin was immunodetected. 1, siRNA2-treated Caco-2 cells, at 80% confluency (two independent experiments); 2, wild-type Caco-2 cells, at 80% confluency; 3, siRNA1-treated Caco-2 cells, at 80% confluency; 4, siRNA2-treated Caco-2 cells; 21 d after confluency (two independent experiments); 5, wild-type Caco-2 cells, 21 d after confluency; and 6, siRNA1-treated Caco-2 cells, 21 d after confluency. (F) Quantification of villin expression. The relative amount of villin was obtained by densitometric scanning of data shown in E.

