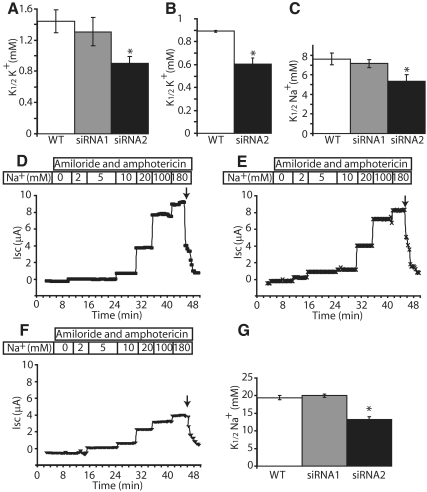
Figure 3.
FXYD3 gene silencing increases the apparent K+ (A and B) and Na+ (C–G) affinities of Na,K-ATPase. (A) Na,K-ATPase activity. Na,K-ATPase activity was assayed at varying K+ concentrations (0.5, 1, 2, and 10 mM) in microsomes from wild-type, siRNA1-, or siRNA2-treated Caco-2 cells, 21 d after confluency as described in Material and Methods. Na,K-ATPase represents the difference of the ATPase activity in the absence and the presence of 4 mM ouabain. Values of the apparent K+ affinities of Na,K-ATPase (K1/2K+) are means ± SEM of five to nine independent experiments. *p < 0.046 versus wild-type Caco-2 cells. (B) Ouabain-sensitive 86Rb uptake in Caco-2 cells. Twenty-one days after confluency, wild-type or siRNA2-treated Caco-2 cells were incubated for 1 h with 86Rb in the presence of various concentrations of K+ with or without ouabain, as described in Material and Methods. Na,K-ATPase-mediated 86Rb uptake was obtained as the difference between the uptake in the absence and presence of ouabain. K1/2K+ values are means ± SEM of three independent experiments. *p < 0.006 versus wild-type Caco-2 cells. (C) Na,K-ATPase activity. Na,K-ATPase activity was measured at varying Na+ concentrations (2.5, 5, 10, and 100 mM) in microsomes from wild-type, siRNA1-, or siRNA2-treated Caco-2 cells, 21 d after confluency as described in Material and Methods. Na,K-ATPase represents the difference of the ATPase activity in the absence and the presence of 4.8 μM ouabain. Values of the apparent affinities of Na,K-ATPase for Na+ (K1/2Na+) are means ± SEM of four to seven independent experiments. *p < 0.036 versus wild-type Caco-2 cells. (D–G) Examples of short-circuit current (Isc) traces in wild-type Caco-2 cells (D), siRNA1-treated (E), and siRNA2-treated Caco-2 cells (F), 21 d after confluency. Isc was measured as described in Material and Methods in the presence of amiloride and amphotericin B and different concentrations of sodium gluconate. Specific Na,K-ATPase activity was determined at the end of the experiment by inhibition with ouabain (arrow) and represented more than 90% of the total current. (G) Determination of K1/2Na+ values from experiments shown in D–F. Values of K1/2Na+ are means ± SEM of three independent experiments. *p < 0.0012 versus wild-type Caco-2 cells.

