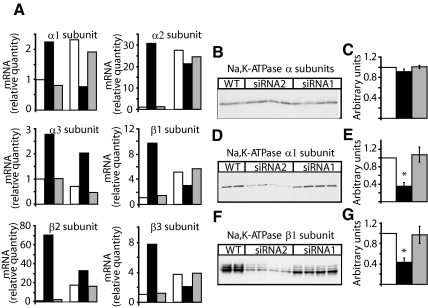
Figure 5.
FXYD3 gene silencing changes Na,K-ATPase isozyme expression. (A) The abundance of Na,K-ATPase isozyme transcripts was quantified by real-time RT-PCR in Caco-2 cells at 80% confluency (three bars to the left) and at 21 d after confluency (three bars to the right). Two experiments with triplicate assays were performed. The target signal was normalized to the reference gene (GAPDH) and the signal for nondifferentiated wild-type cells was put to one. □, wild-type cells; ■, cells treated with siRNA2; and ▩, cells treated with siRNA1. (B–G) Expression of Na,K-ATPase isozymes in wild-type and in siRNA1- or siRNA2-treated Caco-2 cells, 21 d after confluency. Fifty micrograms of protein of cell lysates were subjected to SDS-PAGE and transferred onto nitrocellulose membranes, and the total Na,K-ATPase pool was immunodetected with an antibody recognizing all Na,K-ATPase α isoforms (B). After stripping, the nitrocellulose membrane was probed with a Na,K-ATPase α1 isoform-specific antibody (D) and with a β1 isoform-specific antibody (F). (C, E, and G) Densitometric scanning of data shown in B, D, and F. Results are normalized to the relative quantity of proteins in wild-type cells (□). Shown are means ± SEM of n = 4 for cells treated with siRNA1 (▩) or siRNA2 (■). *p < 0.018 versus wild-type Caco-2 cells. Similar results were obtained in five independent experiments.

