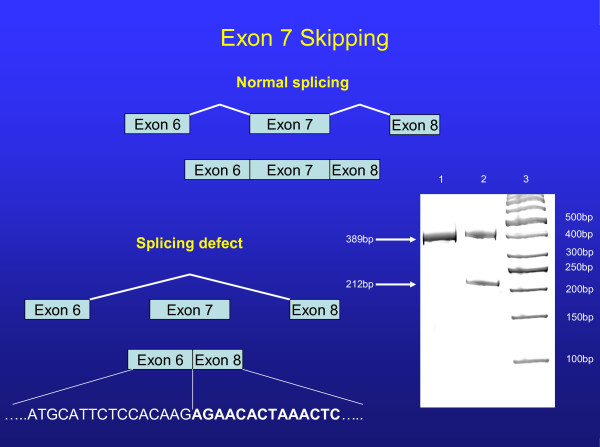
Figure 2.
Normal splicing of exon 7 is illustrated in the top portion of the figure. Schematic representation of exon 7 skipping is shown at the lower portion. A 16% acrylamide gel run of the PCR products from cDNA shows the normal splice product of 389 base-pairs and a splice variant band of 212 base-pairs that results in the elimination of 59 amino acids. Lane 1 (control), Lane 2 (proband). The referent 50 base-pair ladder is shown in lane 3. Sequence of aberrant splicing shown at bottom of figure.

