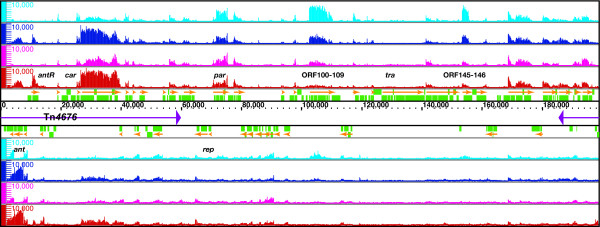
Figure 1.
High-resolution mapping of the pCAR1 transcriptome. Single-stranded cDNA from KT2440(pCAR1) grown on succinate (cyan) or carbazole (blue) and from CA10 grown on succinate (magenta) or carbazole (red) was mapped on both strands of pCAR1, which are transcribed from left to right (above) and from right to left (below). The identified transcripts and annotated ORFs are indicated by orange arrows and green rectangles, respectively. The scale bars indicate the signal intensities from 0 to 10,000 on a linear scale.

