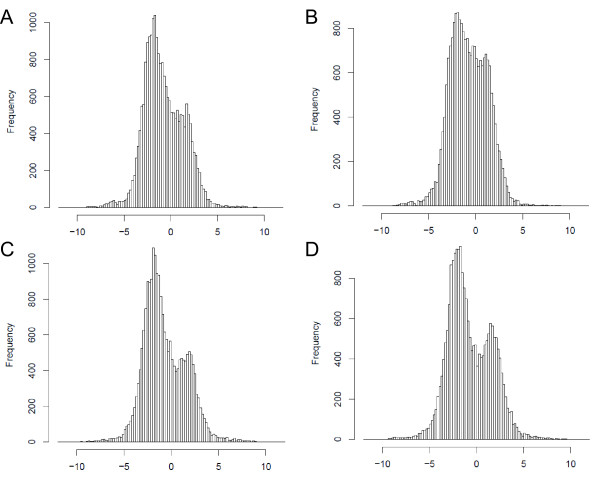
Figure 3.
Histograms showing the log2 ratio of the signal intensities for the sense and antisense strands. The frequency of the signal intensity ratios for a total of 21,875 probe pairs was plotted. All four histograms have two peaks (at 2 and -2), indicating that most of the ratios were 4 or 0.25. (A) KT2440(pCAR1) grown on succinate. (B) KT2440(pCAR1) grown on carbazole. (C) CA10 grown on succinate. (D) CA10 grown on carbazole.

