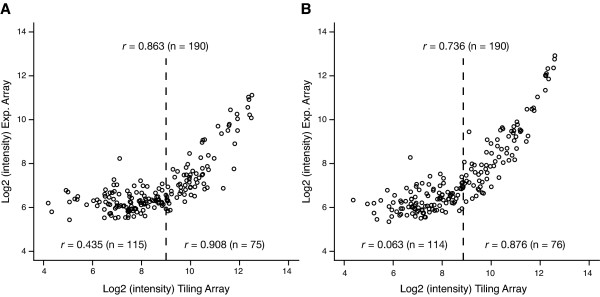
Figure 4.
Comparison of the dynamic range between the tiling array and the expression array platforms. The plots represent the median signal intensities (log2) of 190 pCAR1 genes calculated from the tiling and the expression arrays. The correlation coefficients are for the signal intensities of the overall genes, highly transcribed genes (> 29 in the tiling array), and weakly transcribed genes (< 29).

