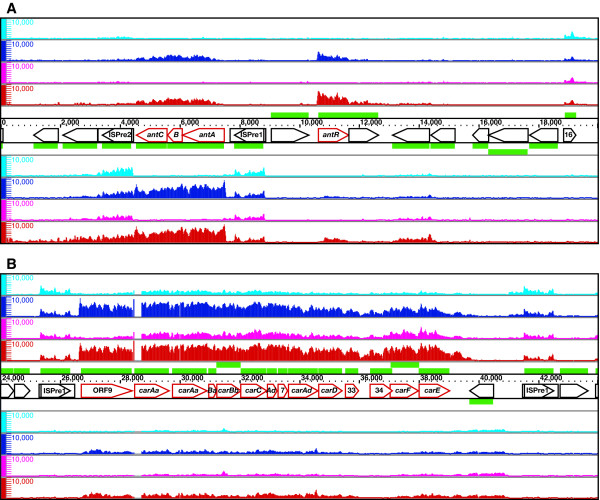
Figure 5.
High-resolution mapping of the catabolic operons induced during growth on carbazole, the ant operon and antR (A), and the car operon (B). Single-stranded cDNA from KT2440(pCAR1) grown on succinate (cyan) or carbazole (blue) and from CA10 grown on succinate (magenta) or carbazole (red) was mapped on both strands of pCAR1, which are transcribed from left to right (above) and from right to left (below). Pentagons represent the pCAR1 genes and their transcriptional directions; the gene names or ORF numbers are indicated therein. The scale bars indicate the signal intensities from 0 to 10,000 on a linear scale. pCAR1 carries duplicate carAa genes [9]; several probes within the first copy of carAa were deleted by the Affymetrix Custom Array Design Program.

