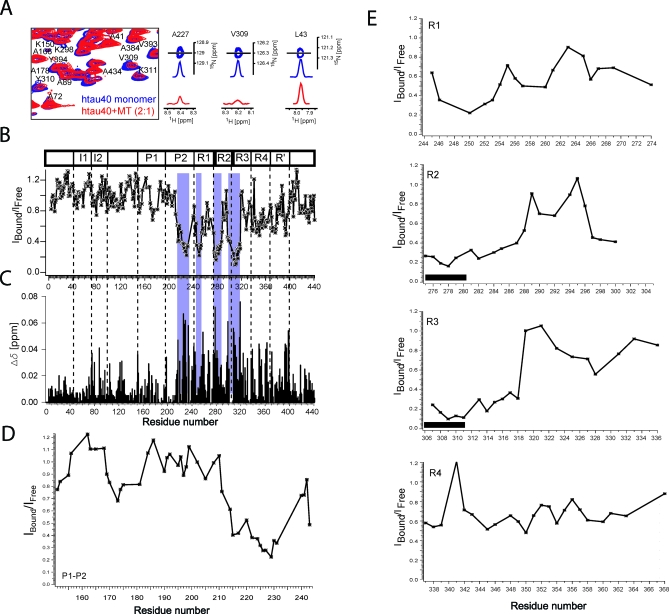
Figure 10. Interaction of Tau with MTs.
(A) Superposition of a selected portion of the 1H-15N HSQC spectra of htau40 in the free state (blue) and in the presence of MTs (red). Resolved peaks are labelled with their assignments. The tau:tubulin heterodimer ratio was 2:1. To highlight changes in NMR signal intensities, a trace through the center (solid line) of selected peaks is shown.
(B) NMR signal intensity ratios between signals observed for htau40 in the MT-bound and in the free state. Repeat boundaries are indicated by vertical dashed lines. Hot spots of binding are highlighted in blue.
(C) Absolute magnitude of 15N chemical shift changes. The estimated error based on 1H-15N HSQCs of two different htau40 samples was 0.025 ppm.
(D,E) NMR signals intensity ratios in the proline-rich regions (D) and in the repeat domain (E). Values were taken from (B). In (E), the position of the two hexapeptides is indicated by black bars.

