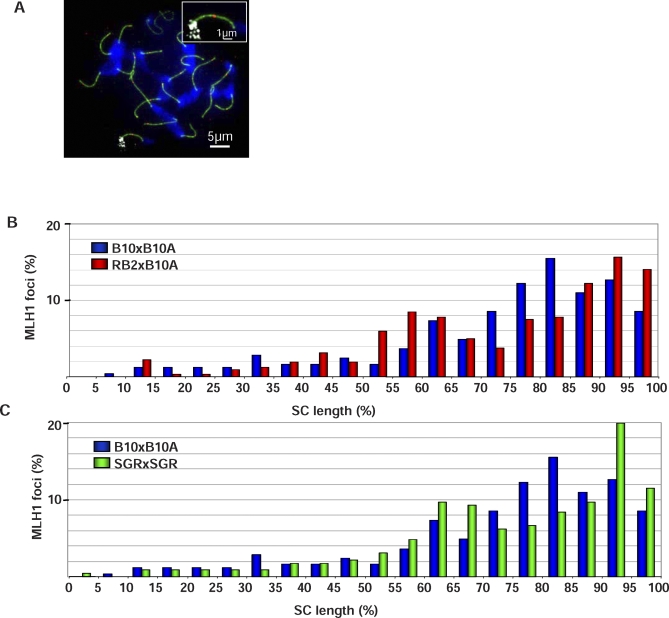
Figure 3. Different Distributions of MLH1 Foci on Chr 17 in B10xB10.A, RB2xB10.A, and SGRxSGR.
(A) Pachytene spermatocyte labeled with SYCP3 (green), MLH1 (red), and Chr 17 probe (mix of BACs RP23-10B20 and RP24-67L15; white) and stained with DAPI (blue). The region of Chr 17 is enlarged in the inset.
(B) Percentage of MLH1 foci per 5% SC length intervals on Chr 17 in B10xB10.A and RB2xB10.A hybrids (n = 245 and 320 foci, respectively).
(C) Percentage of MLH1 foci per 5% SC length intervals on Chr 17 in B10xB10.A and SGRxSGR hybrids (n = 245 and 226 foci, respectively).

