
Figure 2.
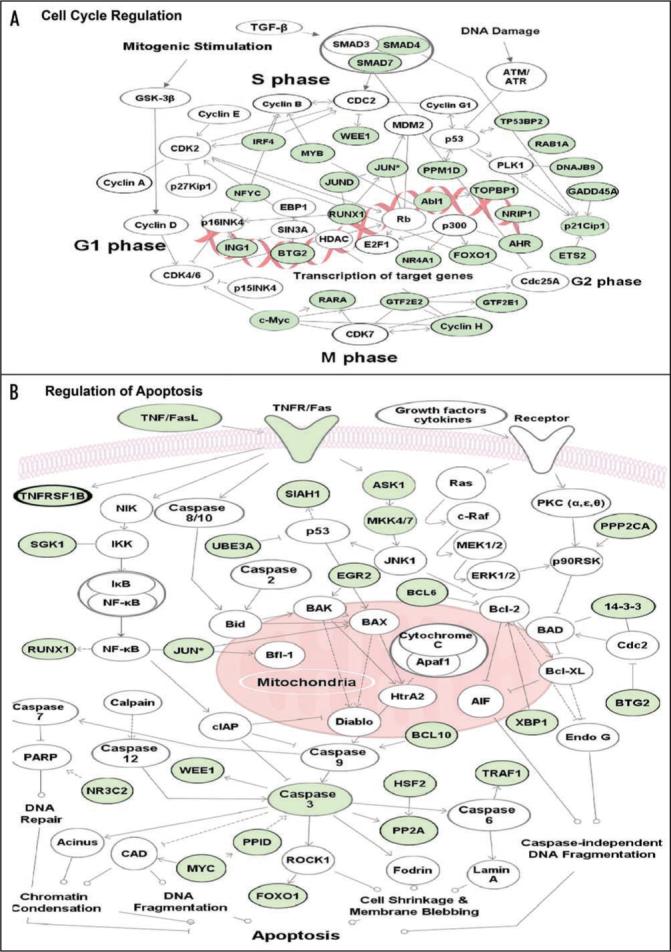
Posttranscriptional regulation of gene networks by GREs. The network diagrams show coordinate regulation of short-lived GRE-containing transcripts involved in (A) cell cycle and (B) apotosis pathways. The transcripts shown in green (on-line) or gray (print) are short-lived transcripts (half-life less than 90 minutes) expressed in primary human T cells66 that contain a consensus nonamer GRE sequence UUGUUUGUU, allowing one mismatch, in their 3′ UTR. Arrows represent direct (solid line) or indirect (dashed line) functional connections identified by Ingenuity Pathway Assistant software (Ingenuity Systems, CA).