
Figure 2.
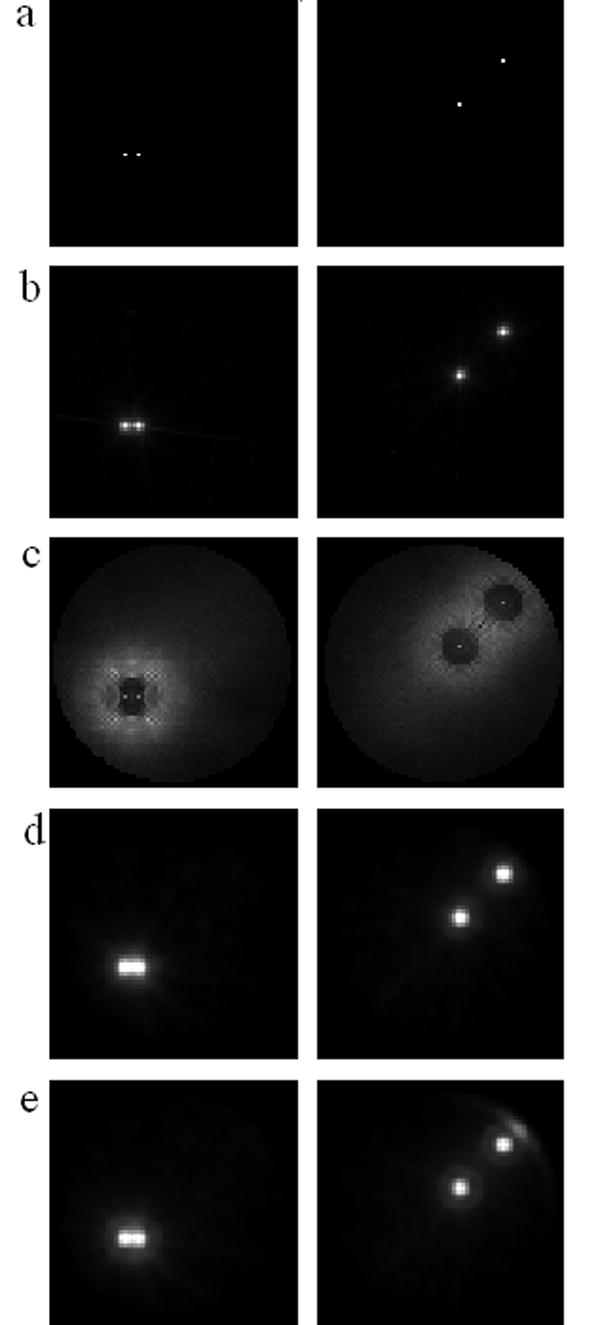
Bootstrap variance maps calculated using simulated data modified by the CTF. We show only selected z-slices, the left column is z=27, the right column is z=47. Contrast within each slice was adjusted independently, so the intensities do not reflect absolute values in respective slices. (a) Variance map of the test structures, (b) variance map obtained with CTF correction, (c) variance map obtained without CTF correction, (d) variance map obtained with CTF correction under strong low-pass filtration, (e) variance map obtained without CTF correction under strong low-pass filtration