
Figure 1. Hydrolysis of L. major ATG8s by L. major ATG4s in vitro.
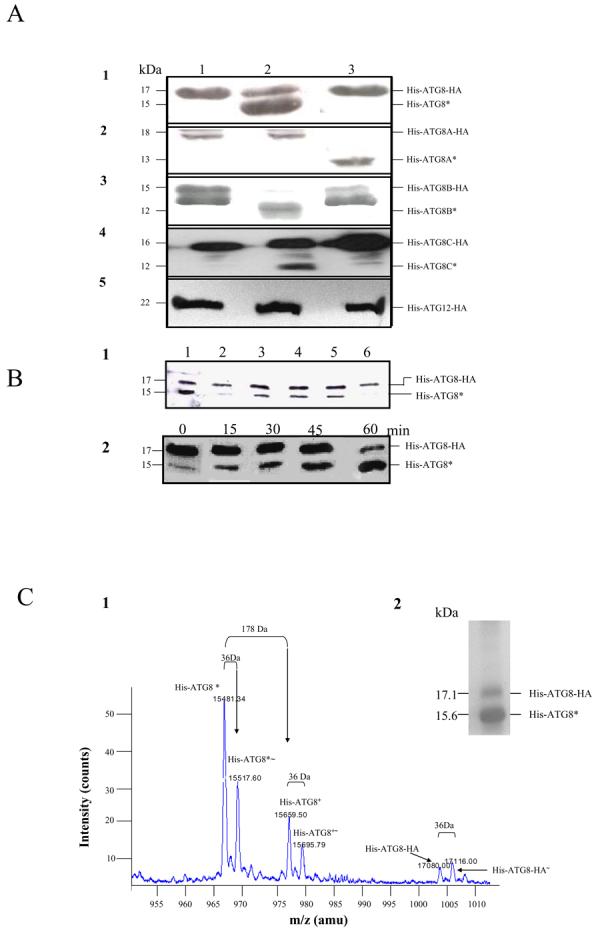
A. Soluble fractions of E. coli expressing His-ATG8-HA (row 1), His-ATG8A-HA (row 2), His-ATG8B-HA (row 3), His-ATG8C-HA (row 4) and His-ATG12-HA (row 5) alone (lane 1) or co-expressed with either ATG4.1 (lane 2) or ATG4.2 (lane 3) were incubated for 30 min at 30°C in 50 mM Tris-HCl, pH 8.0, 125 mM NaCl and 40 mM β-mercaptoethanol and then analysed by Western blot with α-His antibody. The cleaved ATG8 bands are labelled with an asterisk.
B. Hydrolysis of His-ATG8-HA by ATG4.1.
(B1) The hydrolysis was inhibited by 1 mM NEM (lane 2) and 1 mM iodoacetamide (lane 6) but unaffected by 1 mM PMSF (lane 3), 1 mM pepstatin (lane 4) and 10 mM 1,10-phenanthroline (lane 5). Lane 1 shows the control (no inhibitor added). Incubation was as described in A.
(B2) Hydrolysis of His-ATG8-HA by ATG4.1 was progressive over 60 min.
C. Analysis of the product of the cleavage of His-ATG8-HA by ATG4.1. Hydrolysis was over 30 min as described in A.
(C2) The product was purified by Ni+-affinity chromatography and analysed by SDS-PAGE, two main proteins were apparent.
(C1) The cleaved products were analysed by MALDI TOF. Six molecules were detected and their molecular masses are given.