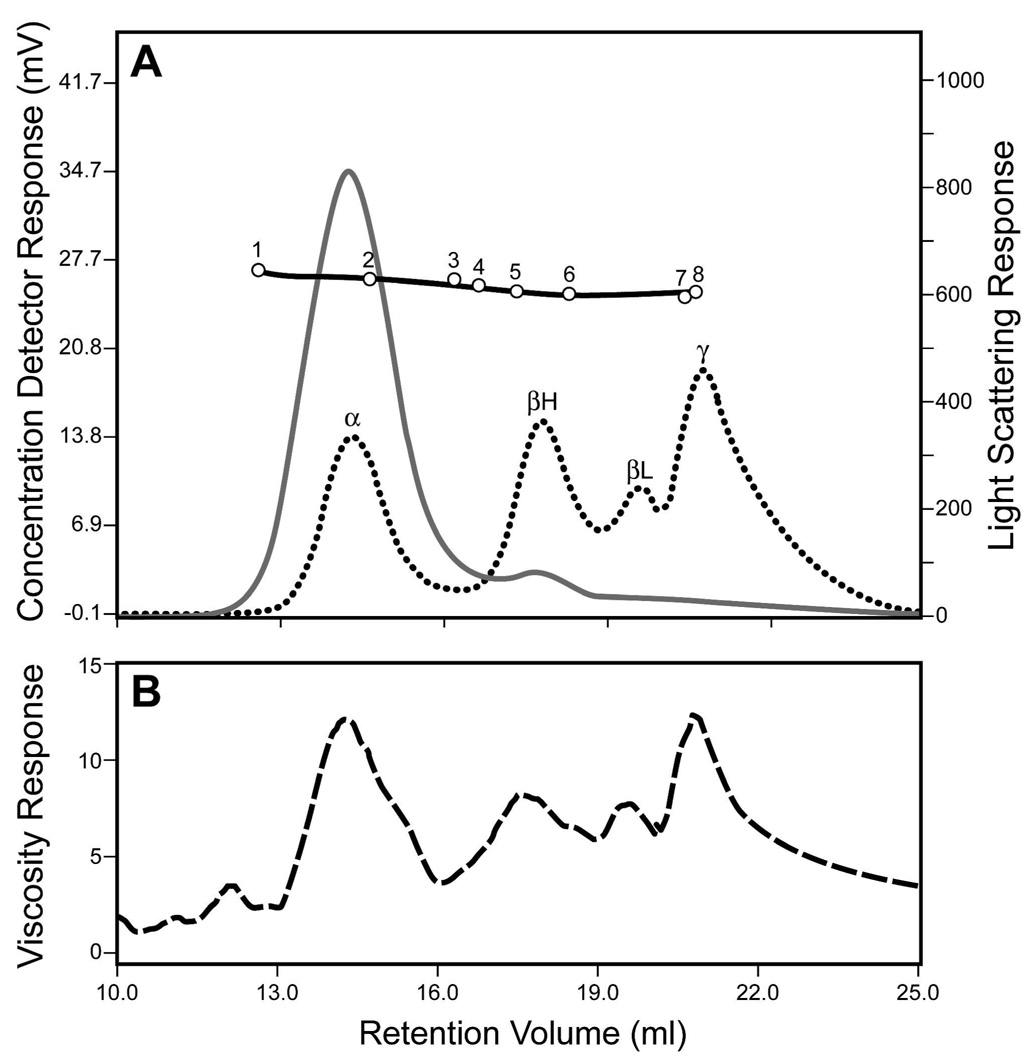
Figure 1. Gel permeation profile of lens proteins from wild type mouse lenses.
(A) Light scattering (solid gray line) and refractive index (dotted black line) measurements on proteins eluting from the column. The column was calibrated using molecular weight markers 1, dextran blue (2 MDa); 2, thyroglobulin (669 kDa); 3, ferritin (440 kDa); 4, catalase (232 kDa); 5, aldolase (156 kDa); 6, bovine serum albumin (67 kDa); 7, chymotrypsin (25 kDa) and 8, ribonuclease A (12.5 kDa). (B) The dashed line indicates the viscosity of proteins eluted from the column. The first peak is α-crystallin (αA + αB), the second is β-heavy (βH) crystallin; the third peak is βL (β-light) crystallin; and the fourth is γ-crystallin.

