Fig. 5.
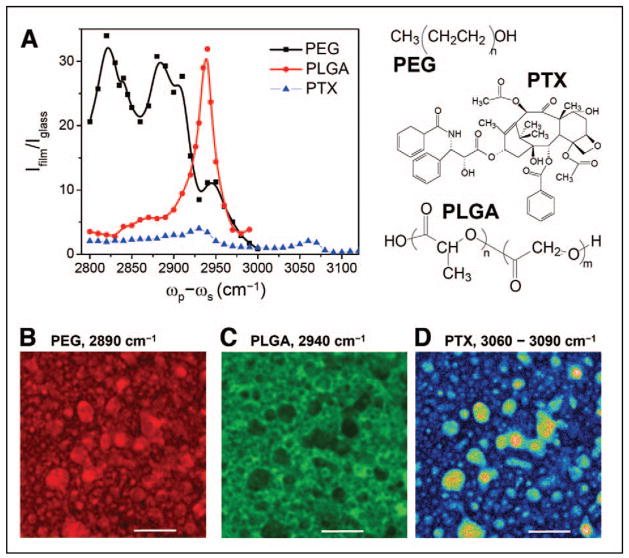
CARS imaging of paclitaxel (PTX) distribution in a PEG/PLGA blend film. (A) CARS spectral profiles of PEG, PLGA, and PTX in the CH stretch vibration region. The molecular structures are shown on the right side. (B, C) Distribution of PEG and PLGA based on the CARS signals from CH2, CH3, and aromatic CH vibration bands, respectively. (D) PTX distribution. Image was obtained by subtracting the CARS image at 3090 cm−1 from that at 3060 cm−1. Bar = 5 μm. Data adapted from the paper by Kang et al.85

