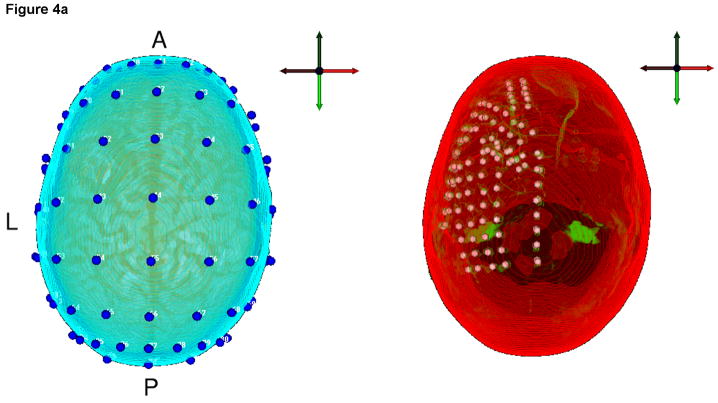
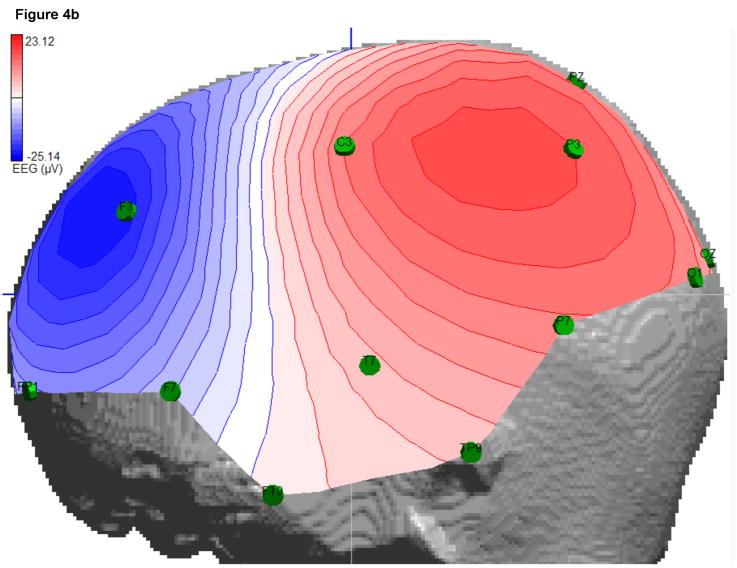
Figure 4.
a) Left: The 10-10 standard system EEG electrodes (blue spheres) mapped to the head model of the patient. Right: The outermost layer of the head model (red) and a segmented part of the co-registered CT dataset (green) are shown together with the extracted and mapped iEEG electrode positions. b) EEG interpolated isopotential distribution at the signal peak.


