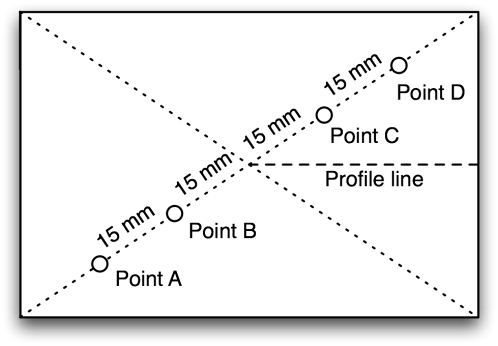
Figure 5. Diagram of points on the slide were thickness measurements were taken.
The thickness of the film on each slide was calculated as the mean of the thicknesses of points A–D. The profile was generated by measuring the thickness at points spaced 1 mm apart (or less near the edge) along the profile line.

