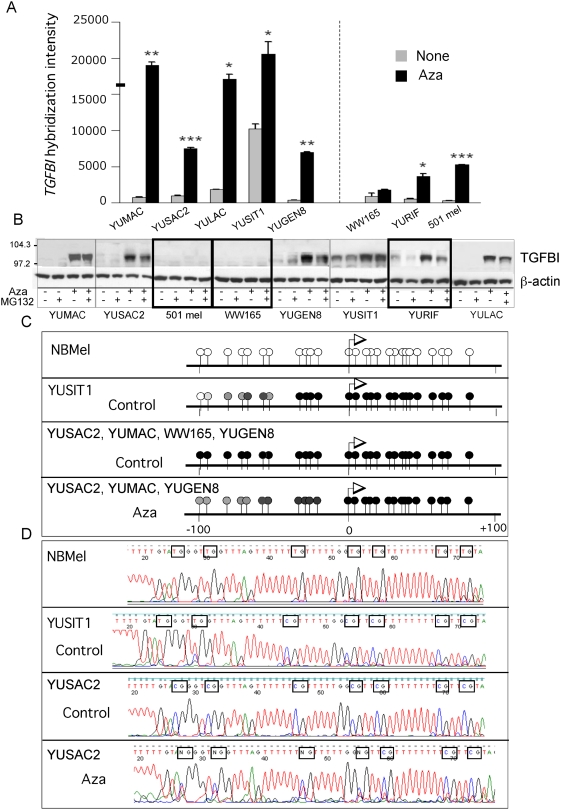
Figure 7. TGFBI reactivation by promoter demethylation.
Panel A. TGFBI re-expression in response to Aza (0.2 µM) as assessed by the oligonucleotide array hybridization. The heavy line on the ordinate represent the levels of TGFBI- transcript levels in adult melanocytes. The data represent one sequence ID. All other details as in Figure 2 panel E. Panel B. Validation of TGFBI re-expression at the protein level by Western blots with anti-TGFBI antibodies employing b-actin as a control. The results are representative of two biological replicas. Panel C. BS sequencing results of TGFBI proximal promoter and first exon in normal human melanocytes (NBMel) and melanoma cells untreated (control), and Aza (0.2 µM) treated cells. Panel D. Chromatograms of the distal promoter about -50 to −100 bp downstream of TSS as shown in C. Boxed nucleotide pairs indicate position of intact (CG), partially BS modified (C/TG) and deaminated (TG) CG pairs. All other details as in Figure 4.

