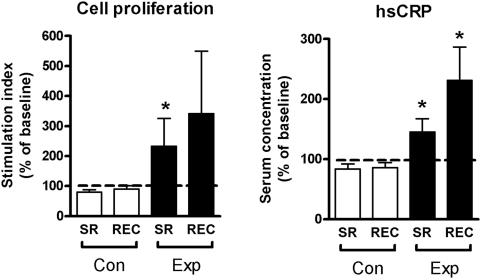
Figure 2. PBMC proliferation and hs-CRP.
Proliferation of PBMC after stimulation with phytohaemagglutinin (PHA, 45 µg/mL) and high sensitivity C-reactive protein (hs-CRP) concentrations in plasma. SR = sleep restriction, REC = recovery, Con = control group, Exp = sleep restriction group. Data are expressed as percentages of participant's individual baseline values (mean±SEM). * p<0.05.

