
Figure 3. Reduced numbers of striatal interneurons after postmitotic loss of Nkx2-1function.
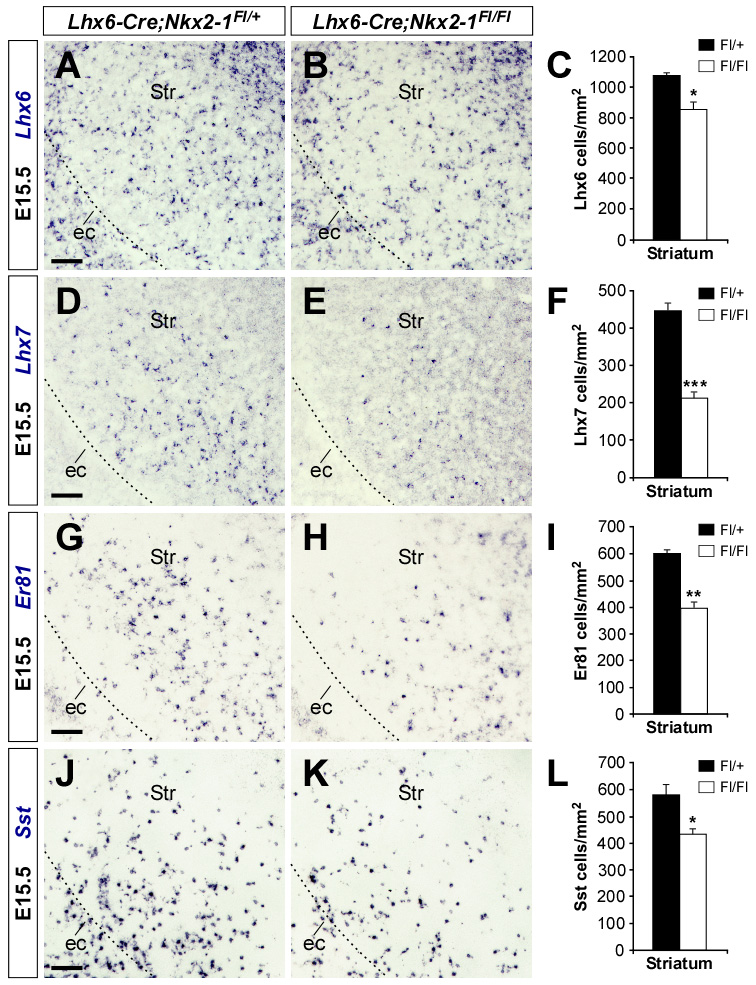
(A, B, D, E, G, H, J and K) Coronal sections through the telencephalon of E15.5 control (A, D, G and J) and Lhx6-Cre;Nkx2-1Fl/Fl mutant (B , E, H and K) embryos showing Lhx6 (A and B), Lhx7 (D and E), Er81 (G and H) and Sst (J and K) mRNA expression. (C, F, I and L) Quantification of the number of Lhx6, Lhx7, Er81 and Sst-expressing cells in the striatum of E15.5 control and Lhx6-Cre;Nkx2-1Fl/Fl mutant embryos. Histograms show average ± s.e.m. 1083.96 ± 23.47 (Lhx6 control); 862.07 ± 49.01 (Lhx6 mutant); 452.32 ± 21.78 (Lhx7 control); 212.02 ± 18.68 (Lhx7 mutant); 601.60 ± 12.74 (Er81 control); 397.05 ± 23.84 (Er81 mutant); 579.03 ± 39.17 (Sst control); 432.18 ± 20.03 (Sst mutant). *** p < 0.001, ** p < 0.01 and * p < 0.05, t-test.
ec, external capsule; Str, striatum.
Scale bar equals 100 µm.