
Figure 8. Nkx2-1 binds the Neuropilin-2 promotor in vivo and regulates its expression.
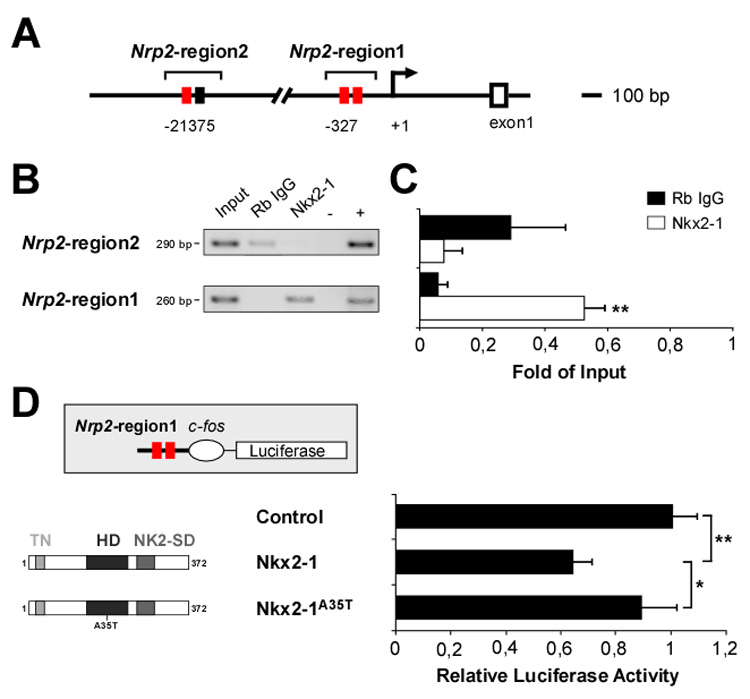
(A) Putative Nkx2-1 DNA binding sites [red and black boxes indicate 8/9 and 6-base pairs (bp) consensus sequences, respectively] in Nrp2-region2 (from -21375 bp 5’-CTTGC-3’ to -21086 bp 5’-GTGCT-3’) and Nrp2-region1 (from -327 bp 5’-CCGGA-3’ to -68 bp 5’-GGGGA-3’) of the Neuropilin-2 locus.
(B) ChIP assays were performed using E13.5 MGE cells and a non-specific rabbit anti-IgG (Rb IgG) or a polyclonal antibody against Nkx2-1. Input chromatin represents 1% of the total chromatin. Negative (-, all reagents except DNA) and positive (+, E13.5 mouse genomic DNA) controls were included in each run. Nrp2-region 2 and Nrp2-region 1 amplicon size (bp, base pairs) are indicated.
(C) The intensity of each PCR band was quantified and normalized against the input band. Histograms show average ± s.e.m. For Nrp2-region2: 0.29 ± 0.17 (Rb IgG) and 0.07 ± 0.06 (Nkx2-1). For Nrp2-region1: 0.06 ± 0.02 (Rb IgG) and 0.52 ± 0.06 (Nkx2-1). ** p < 0.01, t-test.
(D) A luciferase reporter plasmid containing the Nrp2-region1 sequence upstream of the c-fos minimal promoter driving luciferase (pGL3-Nrp2-cfos-Luc) was co-transfected with either mock, Nkx2-1 or Nkx2-1A35T expression vectors. For each condition, the relative luciferase activity corresponds to the ratio of normalized activities from the promoter-luciferase (pGL3-Nrp2-cfos-Luc) and empty-luciferase (pGL3-cfos-Luc) reporter vectors. Histograms show average ± s.e.m. 1.00 ± 0.09 (control), 0.64 ± 0.07 (Nkx2-1), and 0.89 ± 0.13 (Nkx2-1A35T). ** p < 0.01, * p < 0.05, one-way ANOVA followed by Tukey’s post-test.