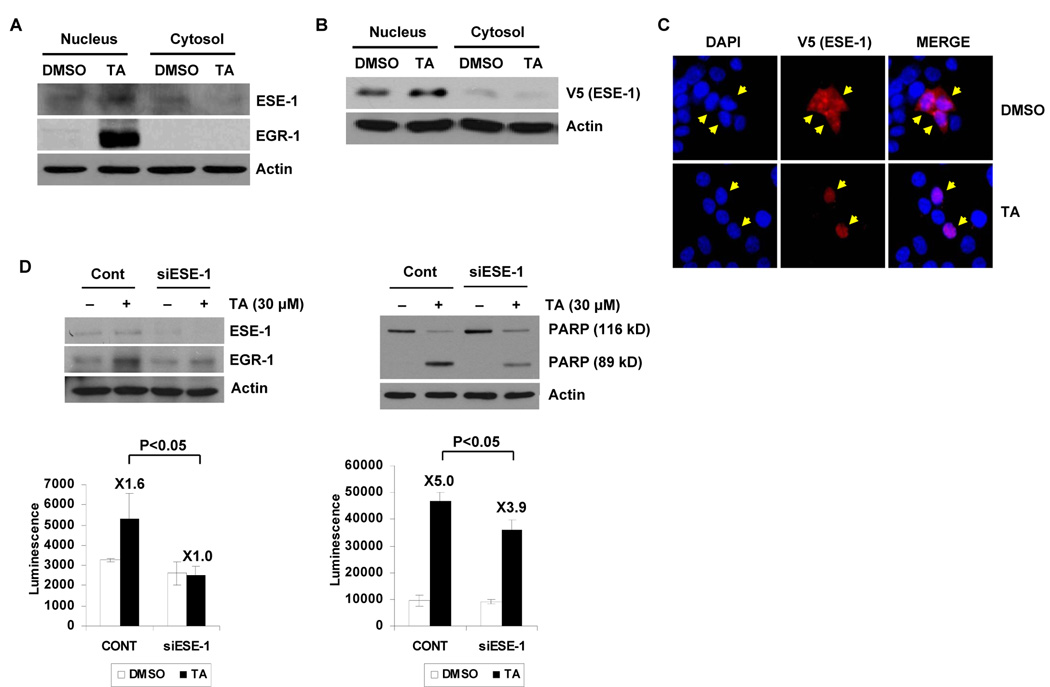
Figure 5. TA mediates translocation of ESE-1 into the nucleus, and siRNA-mediated inhibition of ESE-1 expression suppressed TA-induced EGR-1 expression and apoptosis.
A Nuclear translocation of endogenous ESE-1. HCT-116 cells were serumstarved overnight and then treated with 30 µmol/L of TA for 2 h. Nuclear and cytosol fractions were isolated, and Western blot analysis was performed for ESE-1, EGR-1, and actin antibodies. B Nuclear translocation of exogenous ESE-1. HCT-116 cells were transiently transfected with pcDNA3.1/V5-His/ESE-1 expression vector using Lipofectamine as described in Materials and Methods. After serum-starvation overnight, the cells were treated with 30 µmol/L of TA for 1 h. Nuclear and cytosol fractions were isolated, and Western blot was performed for V5 and actin antibodies. C Immunohistochemistry. After transfection as described in (B), the cells were serum-starved overnight and treated with 30 µmol/L of TA for 1 h. The cells were fixed and stained with anti-V5 antibody overnight and subsequently, secondary anti-mouse TRITC conjugate (red). DAPI staining was used to visualize the nucleus of the cells (blue). Magnifications correspond to 400X. The arrows indicate ESE-1 localization. D Effect of ESE-1 knockdown on TA-induced EGR-1 expression and apoptosis. HCT-116 cells were transfected with control siRNA (100 nmol/L) or ESE-1 siRNA (100 nmol/L) for 24 h using a TransIT-TKO transfection reagent. After serum starvation overnight, the cells were treated with 30 µmol/L of TA for 2 h (left panel) or for 24 h (right panel). Western blot analysis was performed for ESE-1, EGR-1, PARP, and actin antibodies, and caspase 3/7 activity was measured as described in Materials and Methods. The same cell lysates were used to measure caspase 3/7 activity as described in Materials and Methods (bottom panels). The data represent mean ± SD from three independent experiments.

