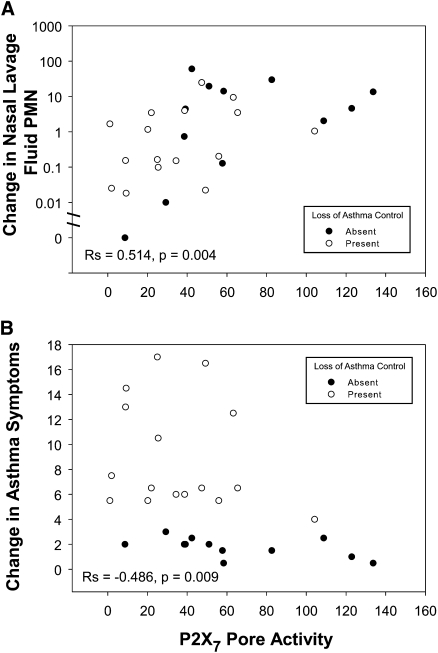
Figure 2.
Change in nasal neutrophil count and asthma symptoms during a cold compared with P2X7 pore function. Baseline nasal lavage neutrophil counts and asthma symptoms were subtracted from the peak levels, respectively, to depict the corresponding changes in cold symptoms. Data are plotted against P2X7 pore function assessed in whole blood samples by the fold change in agonist-induced dye uptake. The presence or absence of a loss of asthma control during a cold is denoted by open symbols and solid symbols, respectively. Spearman correlation coefficients for the entire data set are shown.

