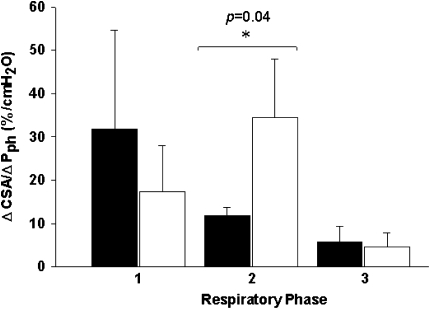
Figure 4.
Relationship of cross-sectional area (CSA) to pharyngeal pressure (Pph) during the control (black bars) and hypocapnic hypopnea (white bars) in three dynamic phases from one respiratory cycle for three different phases: (1) beginning of inspiration to nadir CSA (BI-nadir) at peak inspiration, (2) from nadir to maximal CSA (CSAnadir–CSAmax) at peak expiration, and (3) from maximal CSA to end expiration (as depicted previously by the horizontal arrows in Figure 2). ΔCSA/ΔPph were calculated as the CSA and the corresponding Pph change between the beginning and the end of each phase transition.

