
Figure 3.
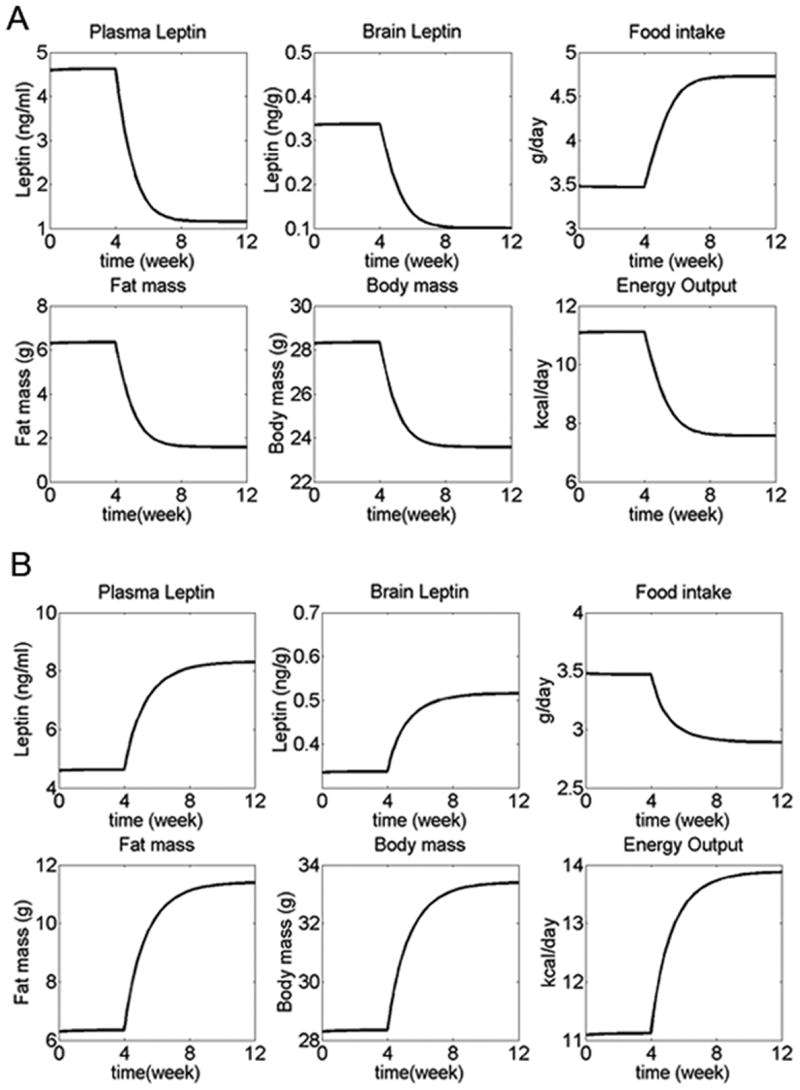
Adaptive changes in response to altered energy intake for the settling point model. Normal diet was eaten during weeks 0-4, while diet energy content was decreased (A), or increased (B) by 50% during weeks 4-12. Plasma and brain leptin levels, fat mass, and total body weight decreased during food restriction and increased during overfeeding, reaching new steady state values. In both cases, food intake and energy expenditure changed in directions that opposed the change in dietary energy content, so that the change in fat mass was diminished.