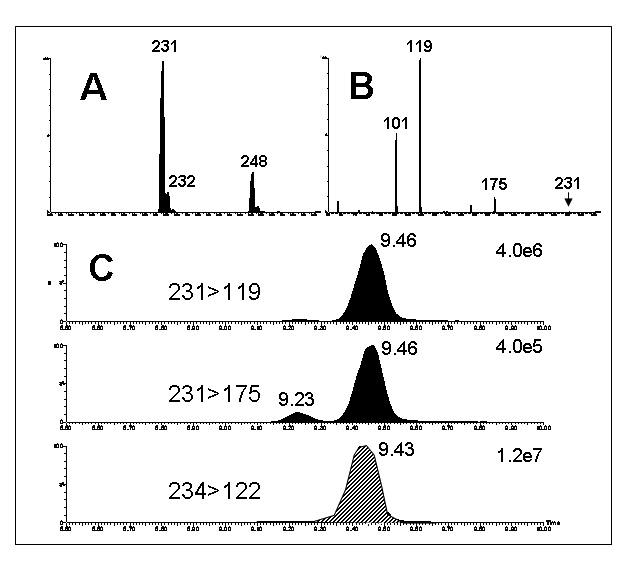
Figure 3.

An example of liquid chromatography-mass spectrometry (LC-MS) analysis of methylmalonate in mouse kidney. Samples were derivatised by butylation to improve sensitivity. A :Single MS spectrum of methylmalonate (M+H ammonium acetate buffer. Note the presence of M+NH4+ = 231) in + = 248. B :Tandem mass spectrum of methylmalonate. C: Multiple reaction monitoring (MRM) chromatograms of methlymalonate (231>119 and 231>175) and the internal standard, 2H3-methymalonate (234>122). The small peak at 9.23 min is due to succinate, an isomer of methylmalonate.
