Figure 1.

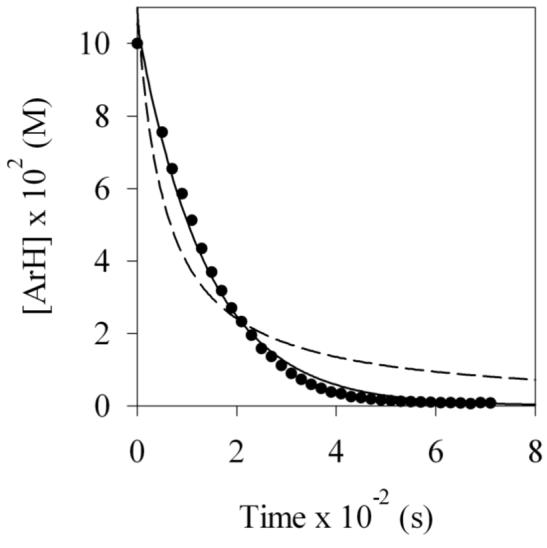
Reaction of 0.10 M carbamate 1 with 0.10 M LDA at −78 °C in neat THF as monitored by 19F NMR spectroscopy. The solid and dashed lines represent least squares fits to first and second order decays, respectively.

Reaction of 0.10 M carbamate 1 with 0.10 M LDA at −78 °C in neat THF as monitored by 19F NMR spectroscopy. The solid and dashed lines represent least squares fits to first and second order decays, respectively.