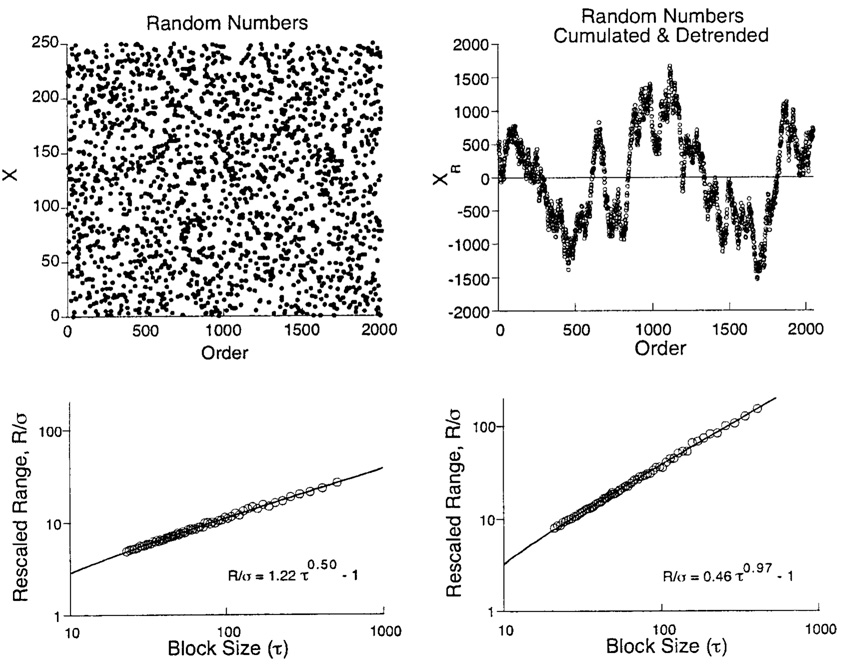
Figure 8.
Top left panel: 2,048 uniformly distributed integer random variables. Bottom left panel: the Hurst diagram for the variates above it. Top right panel: the variates in the first panel are summed and detrended to generate a random walk around XR = 0. Bottom right panel: the Hurst diagram for the variates above it. The construction of Hurst diagrams is detailed in the text and Appendix.

